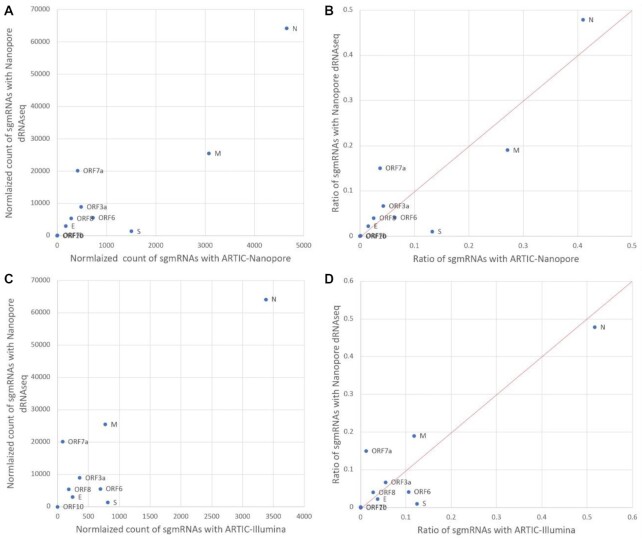
Figure 3.
An X-Y/scatterplot using normalized counts of subgenomic mRNAs (sgmRNAs) (with >5 A residues at the 3′ end—indicative of a polyA tail for the direct RNA sequencing [dRNAseq] data). To generate the scatterplots, Nanopore dRNAseq data were plotted against the either the normalized count (at least one primer sequence) of sgmRNAs with (A) ARTIC-Nanopore sequencing data and (C) ARTIC-Illumina sequencing data or provided as ratio (B) and (D), respectively, for S:orf3:E:M:orf6:orf7a:orf7b:orf8:N:orf10 (using data from Supplementary Tables 3, 4, and 5).

