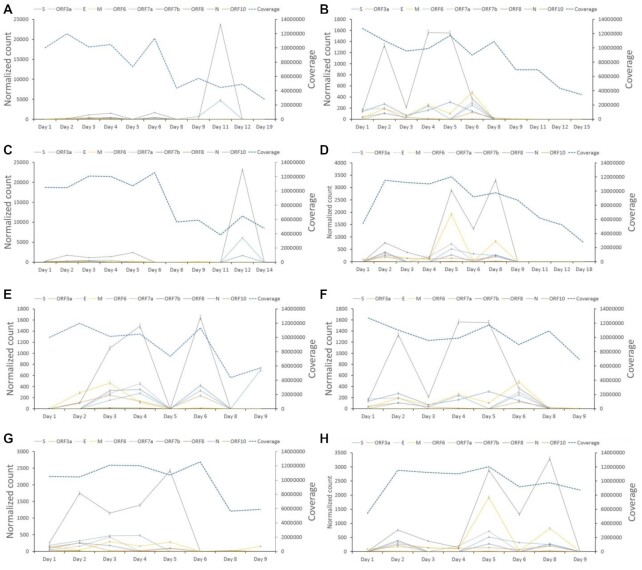
Figure 4.
Analysis of the abundance of reads mapping to the leader–transcriptional regulatory sequence (TRS) gene junctions that have at least one primer sequence at either end in longitudinal nasopharyngeal samples taken from two nonhuman primate models infected with severe acute respiratory syndrome coronavirus 2 (SARS-CoV-2). The time postinfection in days is indicated on the x-axis. The normalized count (read count/total number of reads mapped on the reference genome * 1,000,000) of the leader–TRS gene junction abundance is shown on the left-hand y-axis with each unique leader–TRS gene junction color coded. The right-hand y-axis is a measure of the total depth of coverage for SARS-CoV-2 in that sample. Note the two scales are different. SARS-CoV-2 was amplified and sequenced by ARTIC-Illumina. The data are organized into groups of animals for the cynomolgus macaque groups 1 and 2 (A/E and B/F) and rhesus macaque groups 1 and 2 (C/G and D/H). E, F, G, and H zoom in to see the details of A, B, C, and D for days 1 to 9. The data correspond to that shown in Supplementary Table 7. Standard deviation of a binomial distribution was calculated to provide error bars.

