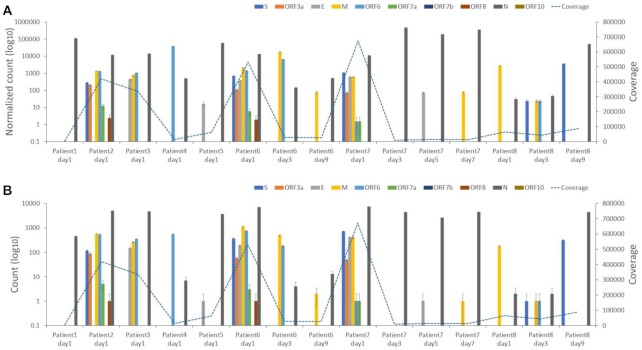
Figure 6.
Plots of normalized peak counts (A) and peak counts (B) of leader–transcriptional regulatory sequence gene junctions of reads with at least one primer sequence at either end derived from sequence data from 15 human patients sequenced with the ARTIC-Nanopore approach and analyzed by using sequence derived from pool 1 primers. The data correspond to that shown in Supplementary Table 9. Standard deviation of a binomial distribution was calculated to provide error bars.

