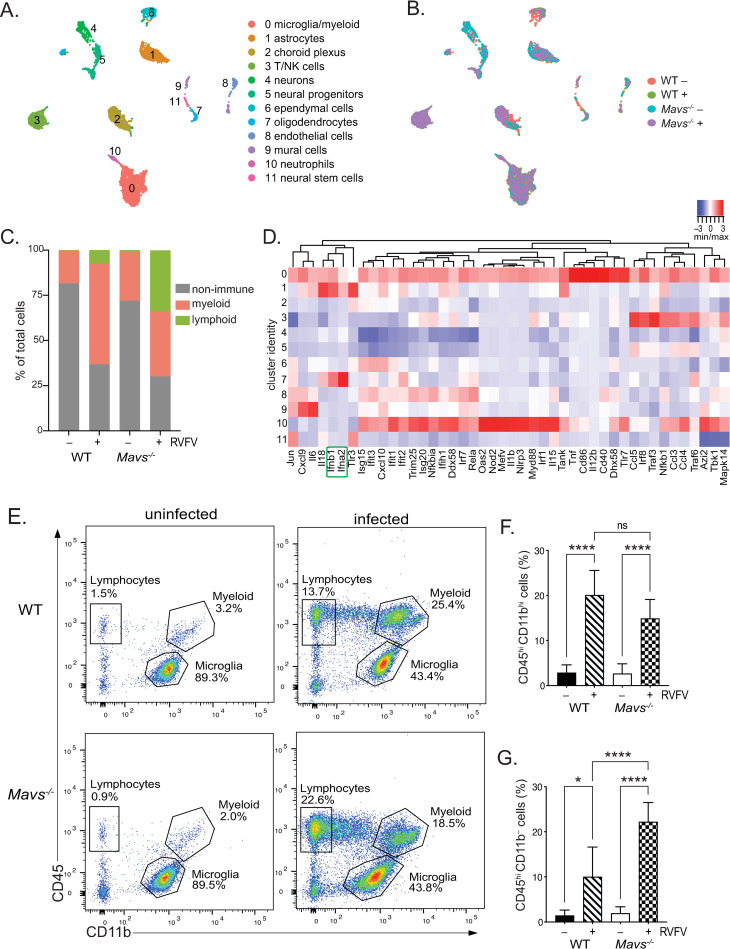
Fig 5. Single cell RNA sequencing reveals shifts in cell populations and immune infiltration in the brain following RVFV infection.
UMAP plots depicting cell clusters derived from WT and Mavs-/- brains, +/- RVFV infection. Cell types (A) or conditions (B) are color coded. The distribution of cell types within brains of each condition (C). A heatmap of IFN ⍺/β signaling genes across cell clusters (defined in (A)) is shown in (D). Ifnb1 and Ifna2 are highlighted in green. Flow cytometry: Representative plots of CD11b vs CD45 and the gates defining microglia, lymphocytes, and myeloid cells are shown for uninfected (left panels) and infected brains (right panels) isolated from WT (top panels) and Mavs-/- (bottom panels) mice (E). The percent myeloid cells (CD11bhi CD45hi), and lymphocytes (CD11b- CD45hi) (F) and (G), respectively. Data in (F) and (G) are shown as the mean +/- SD. *p<0.05, ***p<0.001, ****p<0.0001.

