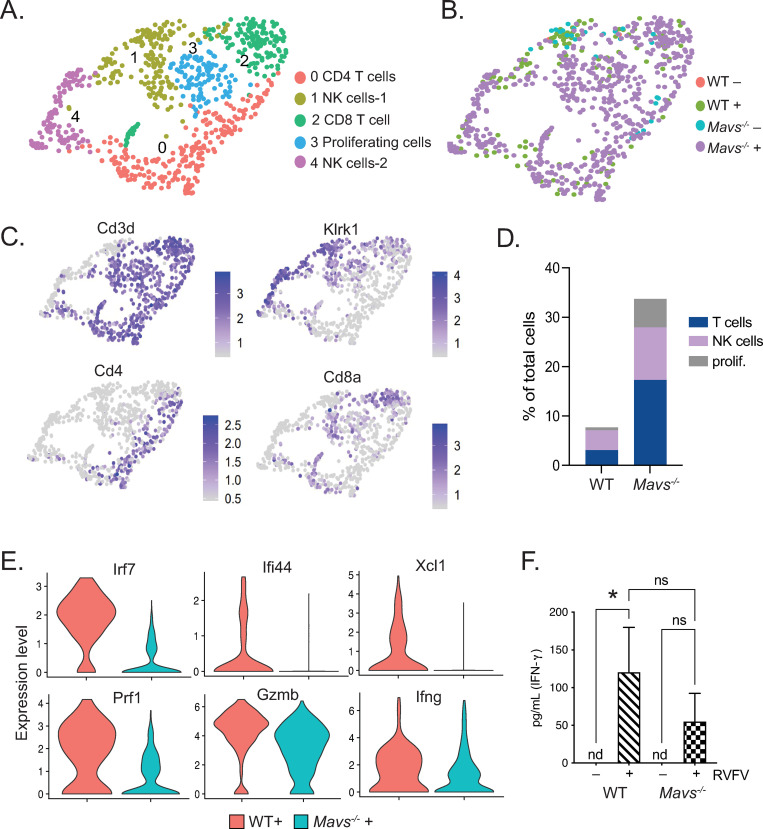
Fig 7. Dysregulated pattern of lymphocyte infiltration and gene expression in brains of Mavs-/- mice.
UMAP plots depicting cell clusters of lymphoid lineage cells derived from WT and Mavs-/- brains, +/- RVFV infection. Cell types (A) or conditions (B) are color coded. Feature plots showing expression of cell type specific markers are shown in (C). The distribution of lymphoid lineage cell types within brains of infected mice (D). Violin plots depicting the relative expression of selected genes within all lymphocytes are shown in (E). Quantitation of IFN-γ is depicted in (F). *p<0.05.

