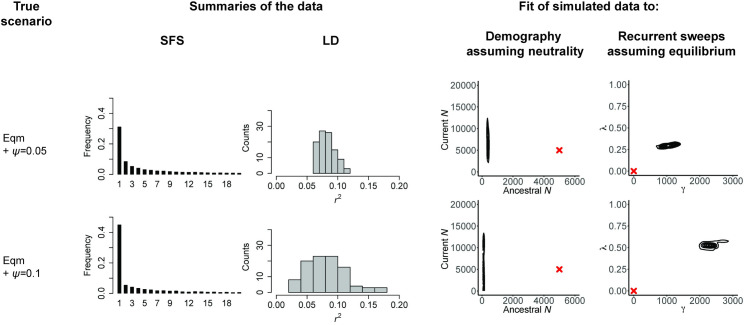
Fig 3. The impact of potential model violations can be quantified.
As in Figs 1 and 2, the scenarios are given in the first column, here, equilibrium population size together with a moderate degree of progeny skew (“Eqm + ψ = 0.05”) as well as with a high degree of progeny skew (“Eqm + ψ = 0.1”) (see Methodology); the middle columns present the resulting SFS and LD distributions, and the final columns provide the joint posterior distributions when the data are fit to 2 incorrect models: a demographic model assuming neutrality and a recurrent selective sweep model assuming equilibrium population size. Red crosses indicate the true values. As shown, this violation of Kingman coalescent assumptions can lead to drastic mis-inference, but the biases resulting from such potential model violations can readily be described. The scripts underlying this figure may be found at https://github.com/paruljohri/Perspective_Statistical_Inference/tree/main/SimulationsTestSet/Figure3. LD, linkage disequilibrium; SFS, site frequency spectrum.

