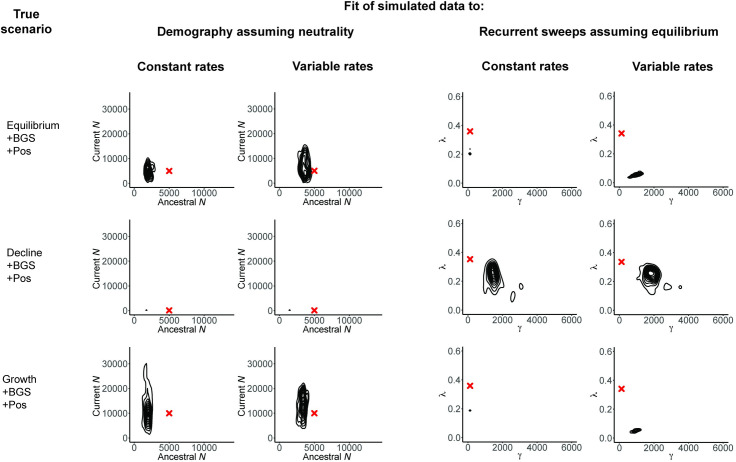
Fig 4. The effects of not correcting for mutation and recombination rate heterogeneity.
Three scenarios are here considered: equilibrium population size with background selection and recurrent selective sweeps (“Eqm +BGS + Pos”), declining population size together with background selection and recurrent selective sweeps (“Decline + BGS + Pos”), and growing population size together with background selection and recurrent selective sweeps (“Growth + BGS + Pos”). Inference is again made under an incorrect demographic model assuming neutrality, as well as an incorrect recurrent selective sweep model assuming equilibrium population size. However, within each category, inference is performed under 2 settings: mutation and recombination rates are constant and known and mutation and recombination rates are variable across the region but assumed to be constant (see Methodology). Red crosses indicate the true values, and all exonic (i.e., directly selected) sites were masked prior to analysis. As shown, neglecting mutation and recombination rate heterogeneity across the genomic region in question can have an important impact on inference, particularly with regard to selection models. The scripts underlying this figure may be found at https://github.com/paruljohri/Perspective_Statistical_Inference/tree/main/SimulationsTestSet/Figure4.

