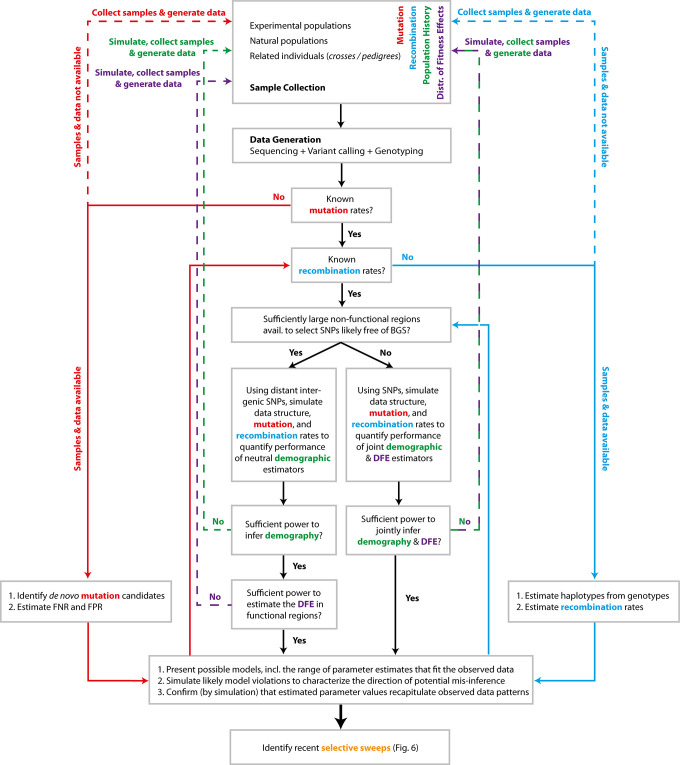
Fig 5. Diagram of important considerations in constructing a baseline model for genomic analysis.
Considerations related to mutation rate are coded in red, recombination rate in blue, demographic history in green, and the DFE in purple—as well as combinations thereof. Beginning from the top with the source of data collected, the arrows suggest a path that is needed to be considered. Dotted lines indicate a return to the starting point. DFE, distribution of fitness effects; FNR, false negative rate; FPR, false positive rate.

