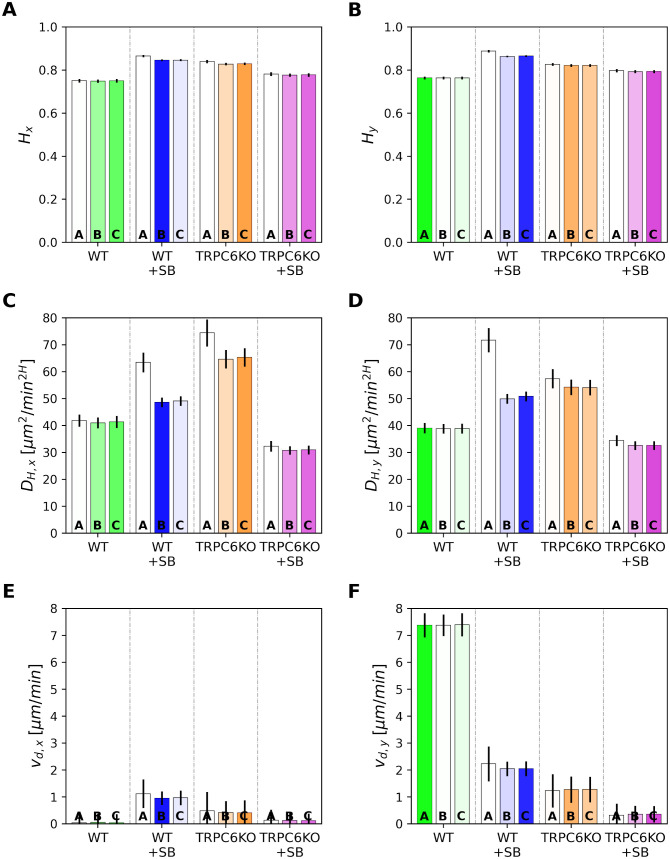
Fig 6. Comparison of model parameters for murine neutrophils.
Parameters are plotted in x- and y-direction together with their standard deviation for the three analyzed models: A—fractional Brownian motion (fBm), B—fBm with exponential tempering, and C—fBm with power-law tempering. The color intensities of the parameter bars are proportional to the corresponding model probabilities in Fig 4. (A) and (B) Hurst exponent H, (C) and (D) generalized diffusion coefficient, (E) and (F) absolute value of drift velocity vd.

