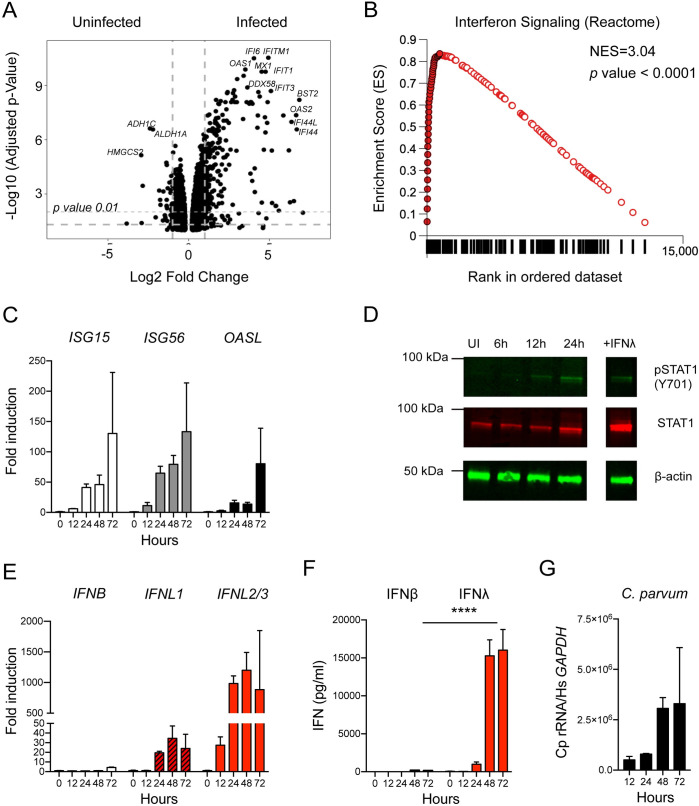
Fig 2. Cryptosporidium infection induces a type III interferon response in human intestinal epithelial cells.
We examined the response to C. parvum infection in HCT-8 to determine which specific interferons were induced. (A) HCT-8 cultures were infected with C. parvum oocysts, and RNA was isolated 48 hours post infection from 3 biological replicates and matched uninfected controls. Volcano plot showing differentially expressed genes between uninfected and infected HCT-8 (n = 3, biological replicates per group). (B) GSEA plot of “REACTOME: Interferon Signaling” signature identified at 48 hours post infection. Closed circles represent genes that make up the core enrichment of the signature. Net enrichment score = 3.04, p value <0.0001. (C) 96 wells HCT-8 cultures were infected with 25,000 C. parvum oocysts for 12–72 hours. Transcript abundance of three representative interferons stimulated genes (ISGs) measured by qPCR is shown over a time course of C. parvum infection (n = 3). (D) Immunoblot showing presence of phospho STAT1 and total STAT1 in uninfected cultures and following C. parvum infection. Treatment with IFNλ is used as a control for induction of phosphoSTAT1. One representative of 2 biological replicates is shown. (E) Samples as in (C). Induction of type I (IFNβ) and type III interferon (IFNλ) transcripts as assessed by qPCR. Note peak of IFNL1: 35-fold, IFNL2/3:1200-fold at 48 hours while peak IFNB: 4-fold at 72 hours. n = 3. (F) Protein levels of type I and type III interferons as assessed by ELISA. Samples as in (C, E) At 48 and 72 hours post infection, the difference between IFNβ and IFNλ was highly significant. Two-way ANOVA with Dunnett’s multiple comparisons **** p <0.0001. n = 3. (G) Relative abundance of C. parvum ribosomal RNA transcripts normalized to host GAPDH. n = 3.

