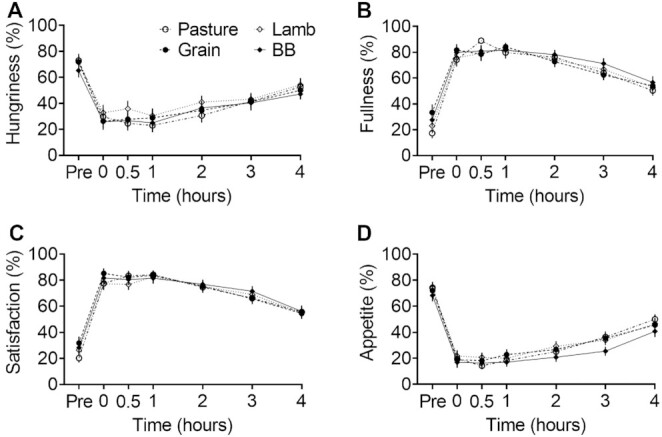
FIGURE 4.

Self-assessed scoring of appetite status anchored at 0 “not at all” and 100 “a lot.” (A) Hungriness score in response to “How hungry do you feel?” (B) Fullness score in response to “How full do you feel?” (C) Satisfaction score in response to “How satisfied do you feel?” (D) Appetite score in response to “How much do you think you can eat?” Markers indicate means ± SEMs (n = 29). The test meal groups contained either pasture-raised beef (Pasture), grain-finished beef (Grain), pasture-raised lamb (Lamb), or Beyond Burger (BB; Beyond Meat). There was an effect of time on all qualities of status, but no group × time interactions.
