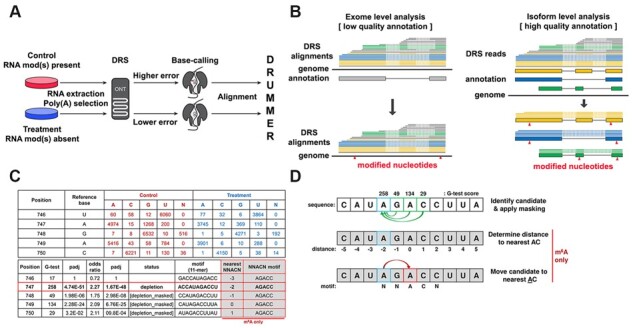
Fig. 1.

Schematic overview of DRUMMER. (A) DRUMMER identifies putative RNA modifications through comparative analysis of nanopore DRS datasets. The presence or increased abundance of a modified ribonucleotide is more likely to result in an incorrect nucleotide being reported during base-calling (i.e. a higher error rate). (B) DRUMMER can process both genome-level and transcriptome-level alignments. In ‘exome’ mode DRUMMER uses sequence read alignments against a genome to predict the location of putative RNA modifications (triangles) in a genomic context. In ‘isoform’ mode, DRUMMER relies on sequence read alignments (blue, yellow, green lines) against a (high-quality) transcriptome and predicts the location of putative RNA modifications (red triangles) at the level of individual transcript isoforms (large blue, yellow, green boxes) and in a genomic context. Note that low-quality sequence read alignments (grey lines) should be filtered prior to analysis. (C and D) DRUMMER parses BAM files using bamreadcount to generate per nucleotide counts of A, C, G, U and N (indels) base-calls in both treatment and control datasets. A G-test (2 × 5 contingency table) is used to determine whether a significant difference in erroneous base-calls is observed between the two datasets at a given position, supported by an odds ratio test to determine whether an increased error rate is observed in the control (depletion of RNA modification abundance in treatment relative to control) or treatment (accumulation of RNA modification abundance in treatment relative to control) dataset. A given site is reported (by default) as a depletion/accumulation candidate if G-test padj < 0.05 and O/R > 1.5. Where multiple sites within a five-nucleotide window are classed as candidates, only the site with the largest G-test score is retained with all others reported as [masked]. Additional reporting shows 11-nt sequence windows centered on the candidate site that can be used for sequence motif/context discovery. When specifically run in m6A detection mode (−m6A), DRUMMER also reports the distance (nt) between a given candidate site and the nearest AC dinucleotide along with the 5-nt sequence motif centered on that nearest AC dinucleotide. Data shown in C and D are derived from isoform-level analysis of the Adenovirus L2-Penton transcript
