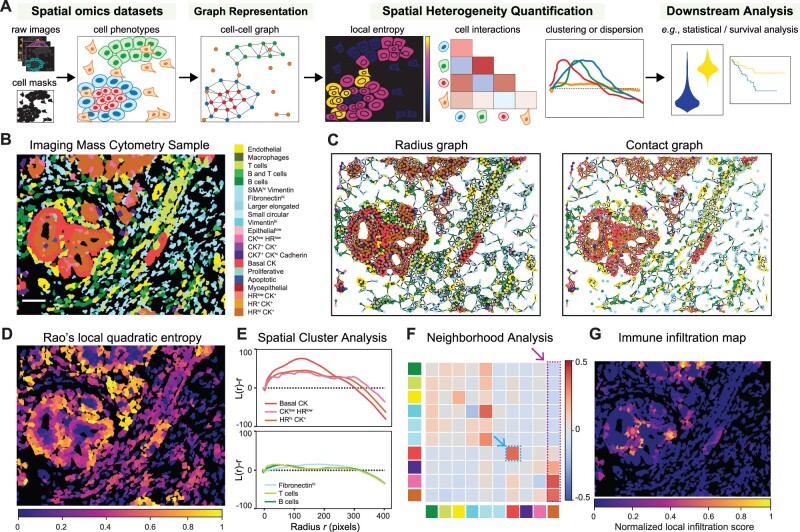
Fig. 1.
Tumor heterogeneity quantification with ATHENA. (A) Schematic overview of ATHENA. (B–G) Results from applying ATHENA to a breast cancer imaging mass cytometry sample from Jackson et al. (2020). ATHENA exploits the spatial phenotypic distribution (B) and constructs a graph representation of the tumor using a radius or a contact graph topology (C). Different heterogeneity scores highlight local tissue diversity (D), degree of spatial clustering or dispersion (E), cell interactions between the 10 most abundance cell types (F) and local immune infiltration (G)

