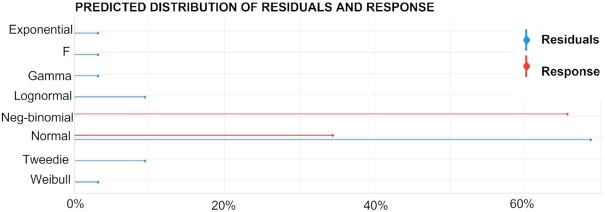
FIGURE 1.
Residuals distribution in model 3 (LDLc change regressed to TG:HDLc ratio and BMI). The appropriateness of linear regression can be corroborated with the R code plot(check_distribution(m3))/mean(m3$residuals)/vif(m3)/durbinWatsonTest(m3). After evaluating 7 possibilities, the most likely distribution of the residuals is normal. The plot was produced with the function performance::check_distribution. (Response is LDLc change.) HDLc, HDL cholesterol; LDLc, LDL cholesterol; TG, triglyceride.

