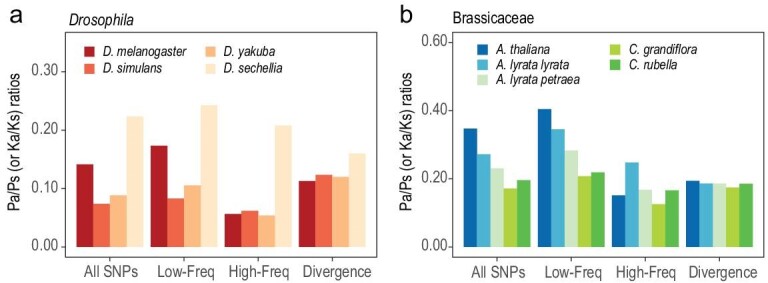
Figure 3.

Pa/Ps ratios within species and Ka/Ks ratios between species. (a and b) The Pa/Ps ratios grouped by frequency and Ka/Ks ratios in Drosophila and Brassicaceae. Variants with a frequency below 0.20 are grouped into Low-Freq bins, and other polymorphisms are grouped into High-Freq bins. The bars at Divergence bins represent lineage-specific Ka/Ks ratios.
