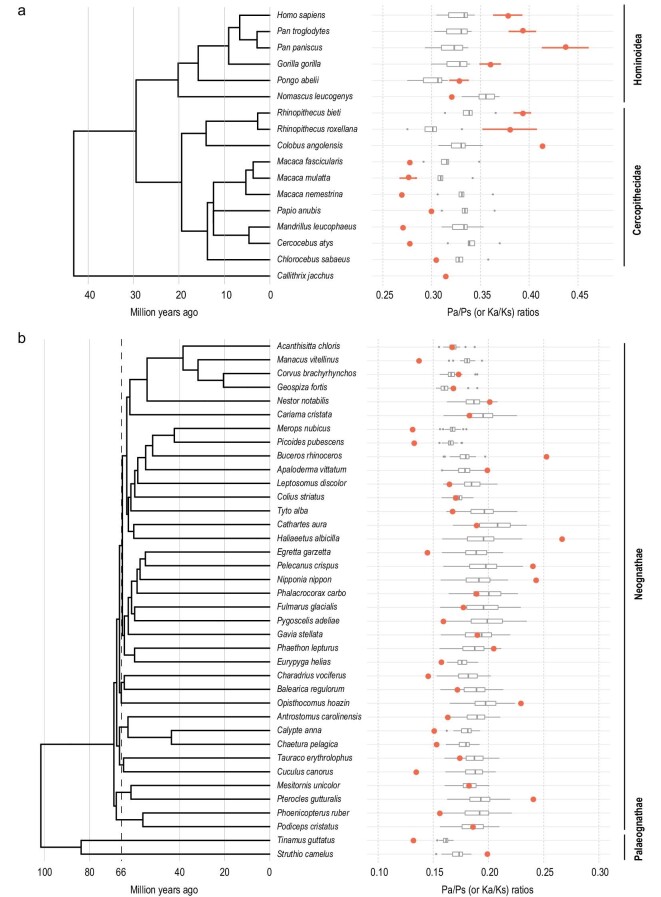
Figure 4.
Pa/Ps ratios within species and Ka/Ks ratios between species. (a and b) Pa/Ps (or Ka/Ks) ratios in primates and birds. The red points show the heterozygous Pa/Ps ratios. Since eight species of primates have genomic data of more than five individuals, their means and standard deviations of heterozygous Pa/Ps ratios are displayed as red points and attached error bars. Each gray boxplot represents the distribution of Ka/Ks ratios between that species and other species on the phylogenetic tree. Note that the Ka/Ks ratios between species in the same family are excluded in panel (a).

