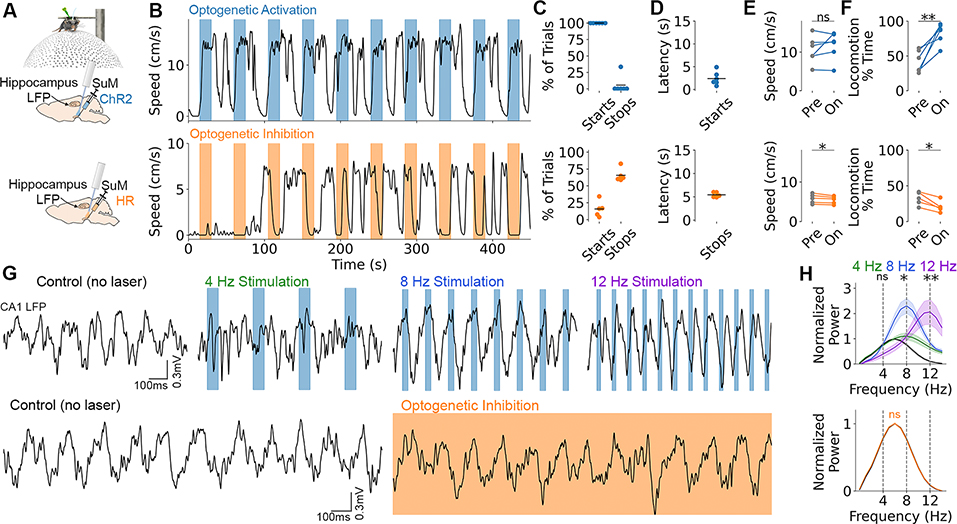
Fig. 2. Optogenetic SuM modulation controls locomotion and hippocampal LFP.
A, Pan-neuronal SuM activation with ChR2 (blue) or inhibition with HR (orange) in head-fixed mice on a floating ball. B, Bidirectional locomotor effect with SuM activation (top) and inhibition (bottom). Colored bars denote laser on. C, Percent of trials where locomotion was initiated or halted for ChR2 (top) and HR (bottom). D, Latency of start vs. stop response. E, Speed during locomotor epochs before (pre) and during (on) light delivery. ChR2, t5=−1.14, p=0.31; HR, t4=3.07, p=0.037. F, Percent of time spent locomoting before (pre) and during (on) light delivery. ChR2, t5=−4.84, p=0.0047; HR, t4=4.60, p=0.010. G, Top: optogenetic activation at 4, 8, or 12Hz compared to no laser control. Blue bars denote laser on. Bottom: optogenetic inhibition (orange shading) vs. no laser control. Scalebar applies across rows. H, Quantification of power spectrum changes normalized to no laser. Top (ChR2): 4Hz power at 4Hz stimulation, t5=0.86, p=0.43; 8Hz power at 8Hz stimulation, t5=5.18, p=0.0035; 12Hz power at 12Hz stimulation, t5=3.99, p=0.010. Bottom (HR): t4=0.043, p=0.97. Data are mean±sem.

