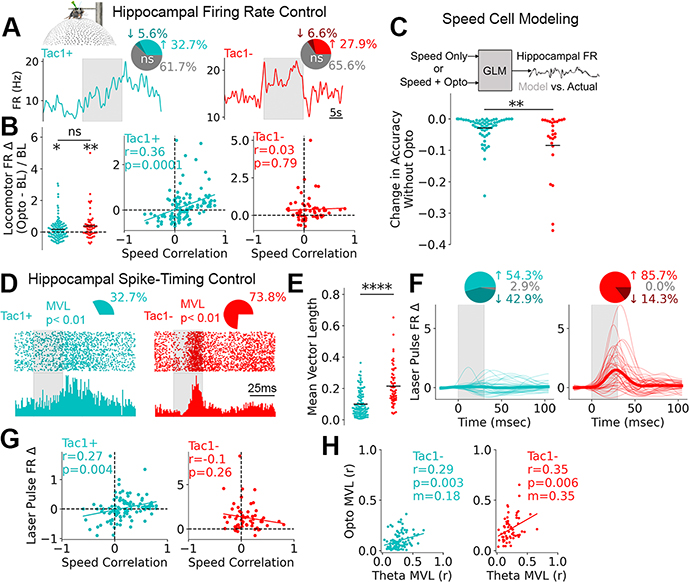
Fig. 4. Hippocampal populations are differentially regulated by SuM cell-types.
A, Data were obtained from head-fixed mice on floating ball. Mean firing rate changes from two example hippocampal cells during SuMTac1+ or SuMTac1− optogenetic activation (grey bar). Pie charts display proportion of units with significantly altered locomotor firing rates. B, Locomotor firing rate change for light on vs. off (one-sample t-test, SuMTac1+ t105=2.56, p=0.012; SuMTac1− t57=3.28, p=0.0017; between sample t-test, t163=1.69, p=0.09) and as a function of speed correlation (calculated while laser is off). Y-label applies to all panels. C, Generalized linear model of hippocampal speed cell FR, with two sets of input (speed only vs. speed + opto). Change in modelling accuracy when optogenetic information was withheld (t89=3.28, p=0.0015). D, Hippocampal spike raster plots with histogram aligned to laser pulses (grey bar) during 8Hz stimulation. Pie charts show the proportion of units with significantly laser-modulated spike distributions. E, Quantification of non-uniform spike distributions from D. t-test t167=7.39, p=6.8×10¹². F, Smoothed spike histograms of significantly laser-modulated cells. Thin lines are individual cells. Thick line is mean. Pie chart shows the directionality of modulation. G, Laser pulse-triggered firing rate change plotted against cells’ speed correlations (calculated while laser is off). H, Firing rate modulation by spontaneous theta vs. optogenetic laser pulses. Lines in B, G and H represent linear fits.

