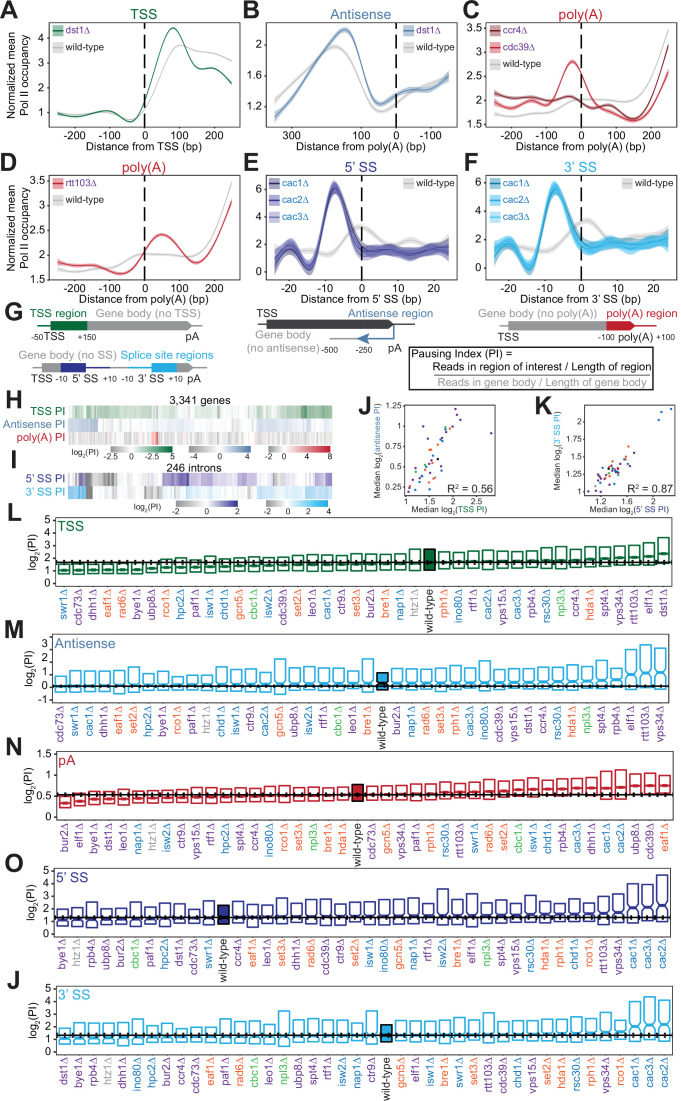
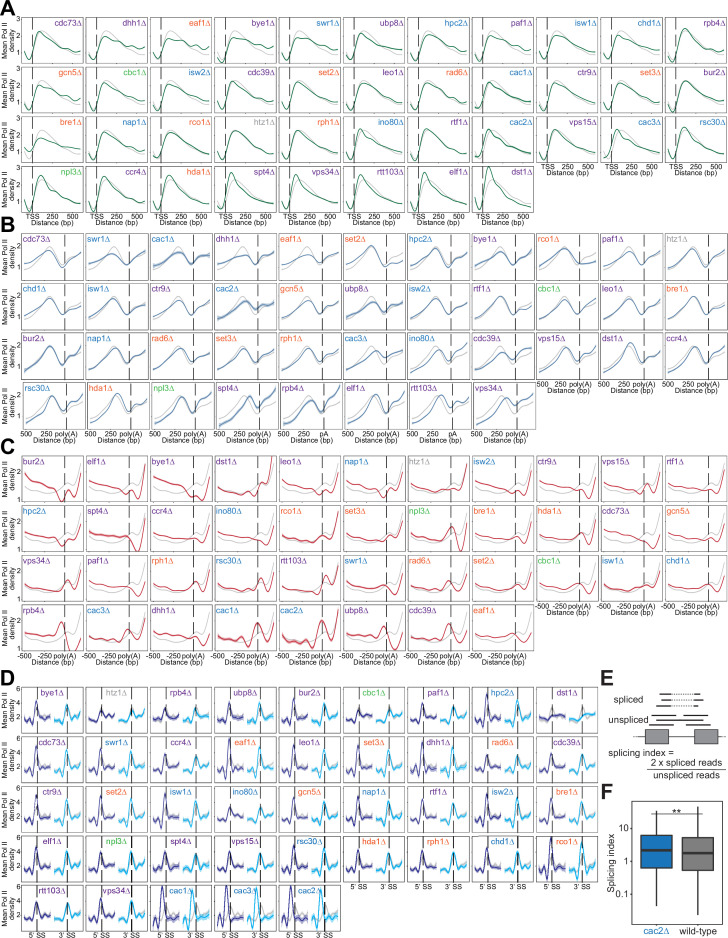
Figure 3. Polymerase II (Pol II) density is increased around transcription start sites (TSS), polyadenylation sites, and splice sites (SS).
(A) Metagene plot of normalized mean Pol II occupancy and the surrounding 95% confidence interval for the 500 bp surrounding the most abundant annotated TSS (Pelechano et al., 2013) (n=2415 genes). Metagene for dst1∆ (green) can be compared to the Pol II density in the wild-type strain (gray). (B) Normalized mean Pol II occupancy and the surrounding 95% confidence interval for the 600 bp surrounding the most abundant annotated poly(A) sites (Pelechano et al., 2013) in the antisense orientation. Metagene for dst1∆ (blue) can be compared to the Pol II density in the wild-type strain (gray). (C) Normalized mean Pol II occupancy and the surrounding 95% confidence interval for the 500 bp surrounding the most abundant annotated poly(A) sites (Pelechano et al., 2013). Metagenes for subunits of the Ccr4-NOT complex deleted (red) can be compared to the Pol II density in the wild-type strain (gray). (D) Same as (C), for rtt103∆. (E–F) Normalized mean Pol II occupancy and the surrounding 95% confidence interval for the 50 bp surrounding annotated 5’ and 3’ splice sites (SS). Metagenes for subunits of the Caf1 complex deleted (blue) can be compared to the Pol II density in the wild-type strain (gray). (G) Cartoon and equation illustrating pausing index (PI) calculation. (H) PI for the TSS (green), polyadenylation [poly(A)] (red), and 3’ antisense (blue) regions across genes. Horizontal axis is hierarchically clustered, revealing TSS, poly(A), and antisense pausing indices for genes in wild-type yeast. (I) Same as (H), for 5’ and 3’ SS pausing indices. (J) Scatter plot of the median pausing indices in the TSS and 3’ antisense regions for all deletion strains. Relationship was quantified using Pearson correlation. (K) Same as in (J), comparing pausing the 5’ and 3’ SS surrounding introns. (L) Boxplot of TSS PI distributions in each deletion strain, ordered by median PI. Horizontal solid line indicates median value for wild-type yeast; dotted lines indicate the 45th and 55th percentile of wild-type PI values. (M–P) Same as (L), for 3’ antisense PI, poly(A) site PI, 5’ SS PI, and 3’ SS PI.


