. 2022 May 16;11:e78944. doi: 10.7554/eLife.78944

Figure 4. Trends in polymerase II (Pol II) pausing behavior at single-nucleotide resolution across deletion strains.

(A) Cartoon illustrating algorithm for robust and reproducible Pol II pause detection. (B) Example of Pol II density on the positive (purple) and negative (red) strands, as measured by native elongating transcript sequencing (NET-seq) in two wild-type replicates. Pauses that meet the 1% irreproducibility discovery rate (IDR) reproducibility threshold are shown as blue vertical lines. (C) Boxplot of the distribution of Pol II pause densities, the number of pauses per kilobase examined, in each deletion strain, ordered by median pausing density. Whiskers and outliers were removed for visualization. (D) Hierarchically clustered heatmap of 8644 Pol II pause loci across the genome reveals locations of pauses shared by multiple deletion strains. Heatmap is colored based on if that locus was identified as a pause (teal), not a pause (white), or if there was not sufficient coverage to determine pause status (gray). Analyses conducted only on deletion strains with biological replicates and only at loci at which there was enough coverage to determine the absence of a Pol II pause in at least one deletion strain. (E) The percent of Pol II pause loci located in the 5’ gene region, mid-gene, and 3’ gene region varies across deletion strains. The 5’ gene region was identified for each well-expressed gene as extending from the transcription start site to the 15th percentile of the gene length. Similarly, the 3’ gene region was defined as the last 15th percentile of the gene length, with the mid-gene region spanning in between. The control (gray) was created by scrambling all identified pauses across all deletion strains within the genes they were identified in. Rows are ordered by the percent of pauses found in the 5’ region. Bars represent the 95% confidence intervals across all expressed genes.

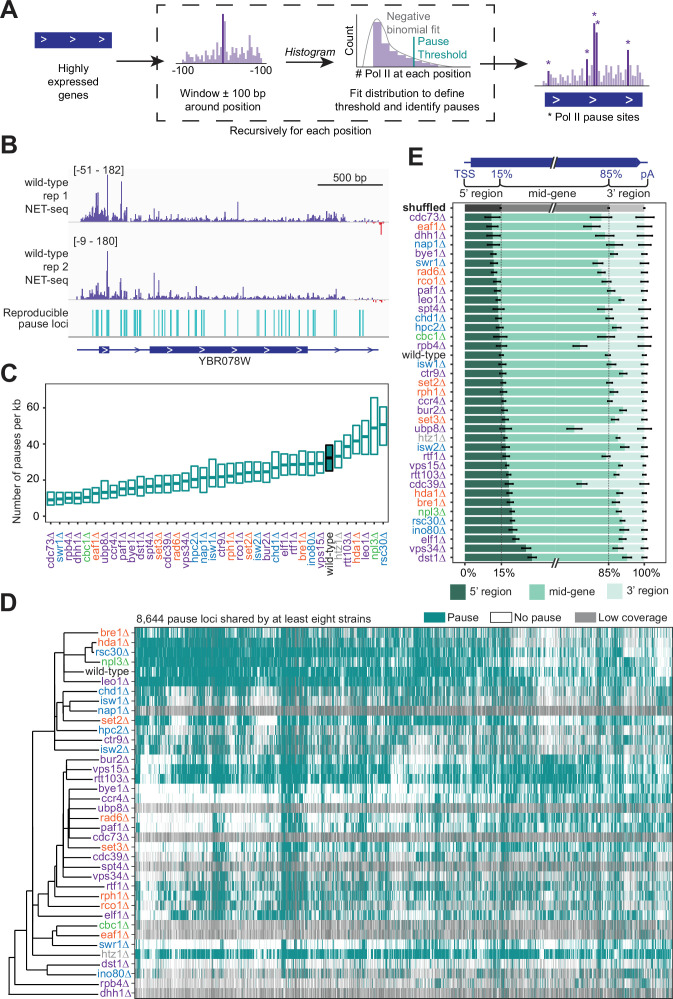
Figure 4.

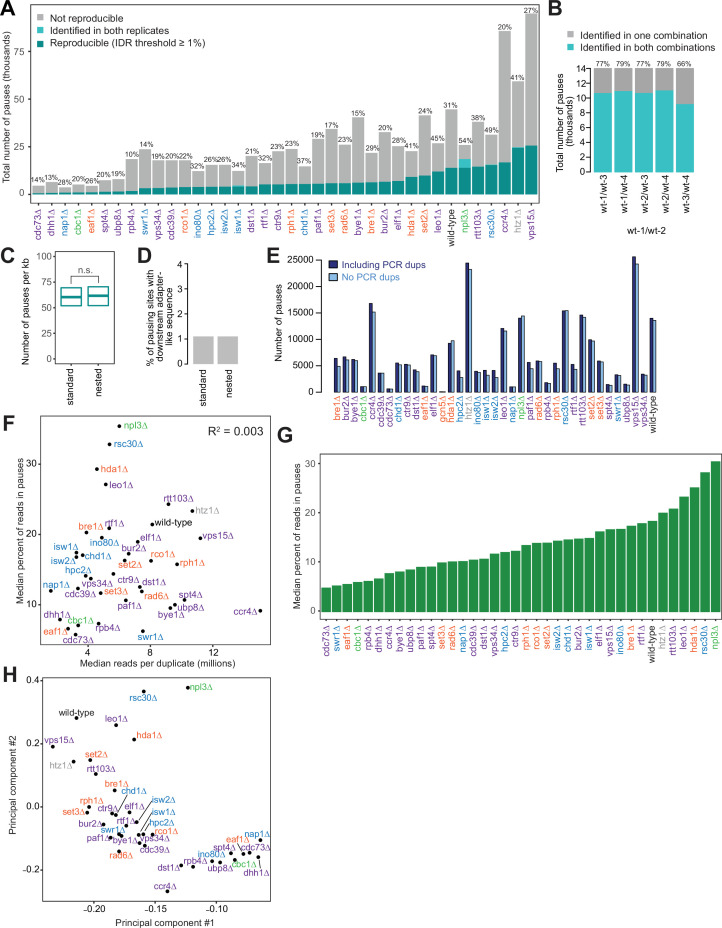
Figure 4—figure supplement 1. Polymerase II (Pol II) pausing behavior at single-nucleotide resolution across deletion strains reveals that pausing is balanced and dynamic in wild-type.

Figure 4—figure supplement 1.

(A) Our analysis algorithm for identifying pause sites uses the irreproducibility discovery rate (IDR) analysis (see Methods). The number of reproducible pauses varies across deletion strains, as does the percent of pauses found to be reproducible. There is a median of 23% of pauses that reproduce across two replicates with an IDR threshold of 1%. Applying an IDR threshold of 1%, the strong pauses (dark cyan) are reproducible, while others do not meet this threshold (cyan), while still others are only present in one replicate (gray). Only genes meeting the coverage threshold for both replicates are considered by the pause-calling algorithm for each deletion strain. (B) Overlap of reproducible pauses called in the wild-type-1 and wild-type-2 pair and every other pair combination of four wild-type replicates. (C) Boxplot of the distribution of Pol II pause densities across genes in samples prepared using standard and nested native elongating transcript sequencing (NET-seq). All pause loci are included here, not just reproducible ones, in order to compare most stringently. There is no significant difference between the samples (p=0.34). Whiskers and outliers were removed for visualization. (D) Number of potential artifactual peaks due to reverse transcription-mispriming for standard and nested NET-seq. Downstream adapter-like sequence: 5’-NNNNNNCTG-3’. (E) Number of pause loci called in each strain with and without removing PCR duplicates using the molecular barcode. (F) Scatter plot illustrating the relationship between the number of sequencing reads obtained in each duplicate for each deletion strain and the percent of NET-seq reads located in pauses across deletion strains. Relationship was quantified using Pearson correlation. (G) Bar plot showing the median percent of reads, mapping to within highly expressed gene bodies, contained within reproducible Pol II pauses, ordered from lowest to highest. (H) Principal component plot based on shared Pol II pause loci across the genome for different deletion strains. Deletion strains with more shared Pol II pause loci are closer together in this plot whereas deletion strains with very different Pol II pausing patterns are further apart.