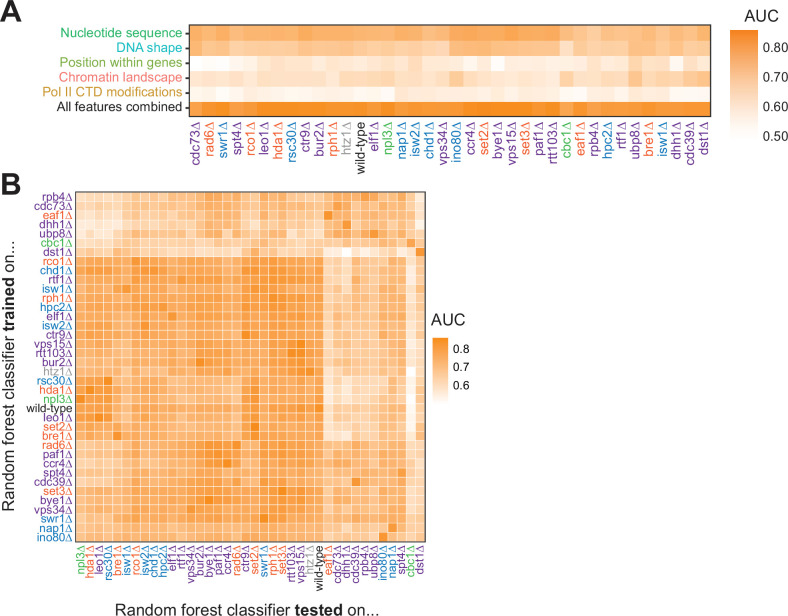
Figure 6. Random forest classifiers identify polymerase II (Pol II) pause loci across deletion strains, with different feature importance values across deletion strains.
(A) Heatmap illustrating the mean AUC for the random forest classifier when trained (75% of loci) and tested (25% of loci) on each deletion strain. Deletion strains are hierarchically clustered along the x-axis. (B) Heatmap showing the AUC values from random forest classifiers trained on all pauses from one deletion strain (y-axis) and tested on those unique pauses observed in another deletion strain (x-axis). Both axes are hierarchically clustered to reveal similarities in AUC values across deletion strains. Tiles when the same training and testing strain are indicated are colored according to the AUC for that deletion strain when 75% of pauses in that deletion strain are used for training and the remaining 25% are used for testing as reported in (A).


