
Figure 3.
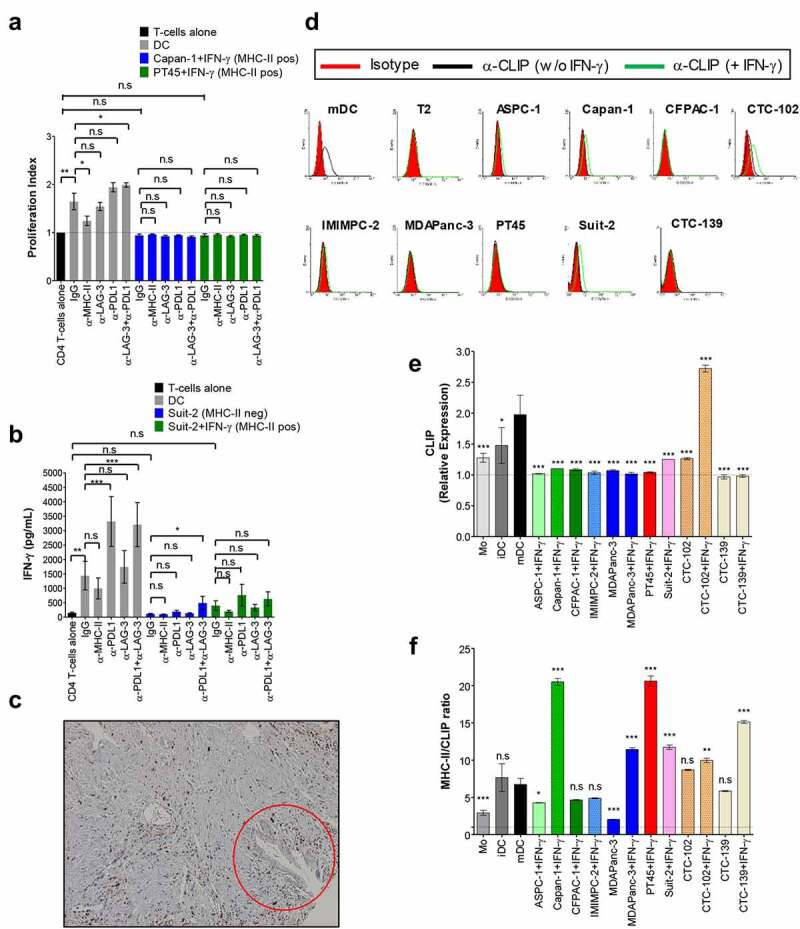
MHC-II on PDAC cells seem to be loaded with tumor-derived peptides despite the absence of HLA-DM and poor immunostimulatory capacity. Allogenic activated CD4+ T-cells were cultured with MMC-treated PDAC cells (T-cell:tumor ratio 2:1) in the presence of blocking antibodies as indicated or isotype control (IgG) for 4 days. T-cell proliferation was determined by CFSE as in Figure 2 and results are expressed as mean values and S.E.M of the proliferation index (A). Supernatants of co-cultures of MHC-II-negative and – positive PDAC lines were collected and assayed for IFN-γ by ELISA (B). Allogenic mature DCs (T-cell:DC ratio 10:1) were used as positive control. Expression of HLA-DM in PDAC specimens was assessed by IHC (C). Tumor cells indicated by the red circle are positive for MHC-II as shown in Figure 1(a). Expression of CLIP on untreated or IFN-γ-treated PDAC cell lines was determined by staining cells with anti-CLIP antibody and analyzed by flow cytometry. The histograms show the expression of CLIP by cells from one representative experiment (D), and the graph in (E) shows mean fold changes with S.E.M of the expression of the marker from the three experiments combined. In (F) is shown the ratio between MHC-II and CLIP. T2 cells and mDC in D were used as negative and positive control for CLIP, respectively; Mo, iDC and mDC shown in E and F were used as positive control for the expression of CLIP. All data were analyzed by one-way ANOVA. *P < 0.05; **p < 0.01; ***p < 0.001; n.s: non-significant. P values shown in E and F refer to the comparison of the indicated cell line vs. mDC. Values shown in A were from independent experiments with 4 donors; and in B is shown values from 6 donors. Magnification of image shown in (C): 10×.