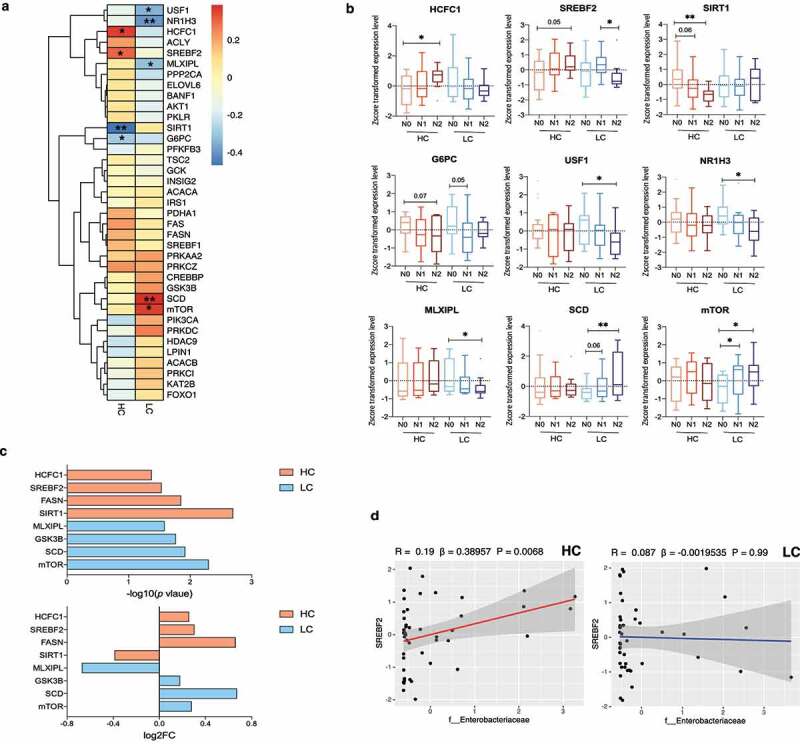
Figure 5.

Changes in de novo lipogenesis (DNL)-related transcripts in the high carbohydrate (HC) intake group. (a) Heatmap displaying the correlation between DNL-related genes and the NAFLD activity score (NAS) in the HC and LC groups. Statistical analysis was performed using transformed z scores and Spearman’s rank correlation analysis. (b) Z score-transformed expression levels of predefined transcripts were compared between the HC and LC groups according to NAFLD severity using an one-way analyses of variance and the FDR correction for multiple comparisons. (c) Differentially expressed genes were defined using the R package DEseq2. The upper panel indicates log10 transformed P values and the lower panel indicates log2 transformed fold changes. (d) The linear regression model depicts the relationship between SREBF2 and Enterobacteriaceae after adjustment for BMI, age, and sex (*P < .05, **P < .01, ***P < .001).
