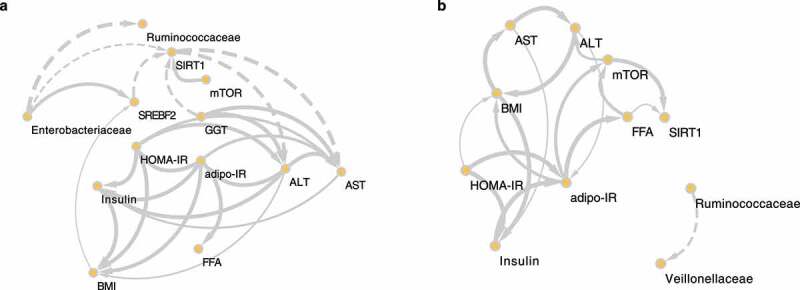
Figure 7.

The causal relationships among nonalcoholic steatohepatitis (NASH)-related microbes, transcripts, and clinical factors in the high carbohydrate (HC) and low carbohydrate (LC) intake groups. Causal inference of inverse, normally transformed microbiome families (Ruminococcaceae and Enterobacteriaceae), transcripts (SREBF2, SIRT1, and mTOR), and clinical variables (ALT, AST, adipo-IR, HOMA-IR, insulin, FFA, and BMI) were calculated using kernel causality analysis; significant causal correlations were visualized using Cytoscape. Causality of variables in the (a) HC and (b) LC groups. Solid line indicates a positive correlation and the dashed lines indicates a negative correlation. The thickness of the line indicates the degree of statistical significance (thin: less significant P values; thick: more-significant P values).
Abbreviations: SIRT1, silent mating type information regulation 2 homolog 1; mTOR, mechanistic target of rapamycin kinase; SREBF2, sterol regulatory element-binding transcription factor 2; GGT, gamma-glutamyl transferase; HOMA-IR, homeostasis model assessment of insulin resistance; adipo-IR, adipose tissue insulin resistance; BMI, body mass index; FFA, free fatty acids; ALT, alanine transaminase; AST, aspartate transaminase.
