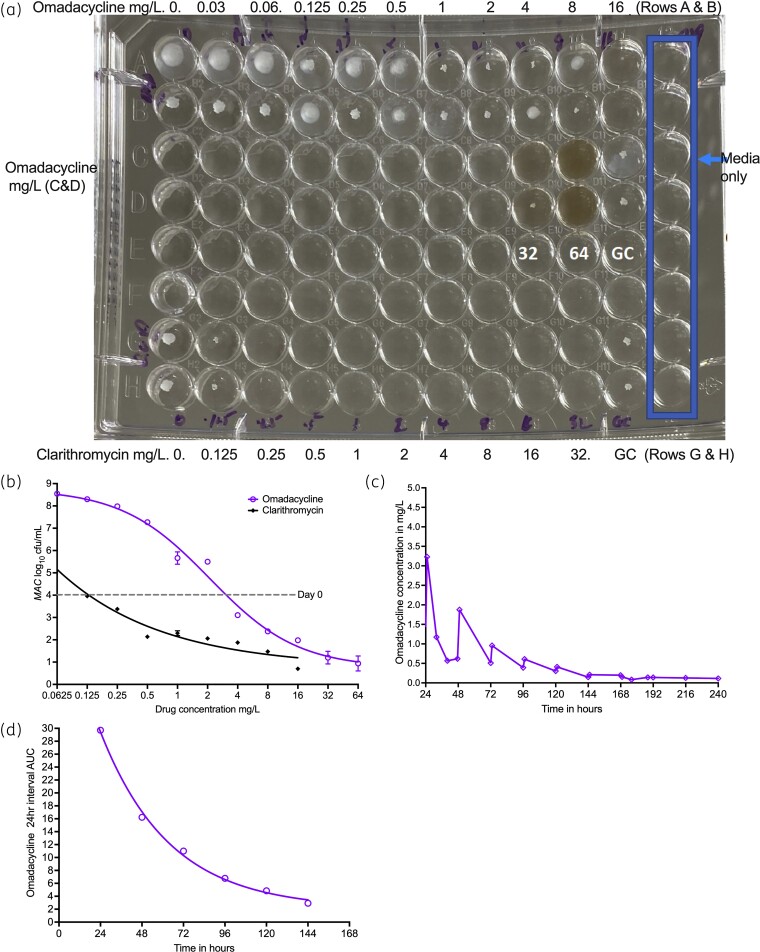
Figure 1.
MICs and omadacycline stability. (a) Visual inspection of plates demonstrates omadacycline trailing effect and an MIC of 16 mg/L. (b) The wells were cultured for colony forming units and results modelled using inhibitory sigmoid Emax model. The lowest concentration associated with a bacterial burden below that on day 0, which corresponded with clarithromycin MIC, was used to read the omadacycline MIC. Since the x-axis is a log-scale, and log 0 does not exist (or is undefined), the lowest concentration shown is at 0.0625 mg/L and not 0 mg/L. (c) Decline in omadacycline concentration with time when infused from the same solution in a syringe. (d) The drug AUC decline followed an exponential decline model. This figure appears in colour in the online version of JAC and in black and white in the print version of JAC.

