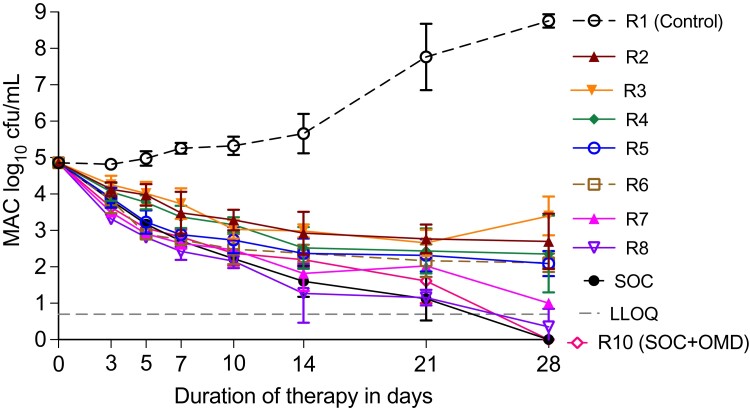
Figure 3.
Change of MAC burden with treatment in the HFS-MAC. Symbols show the mean cfu per mL and error bars are standard deviation. Particularly interesting is using the three-drug standard of care (SOC) as the context, and that high dose monotherapy has efficacy that equals that of SOC. This figure appears in colour in the online version of JAC and in black and white in the print version of JAC.

