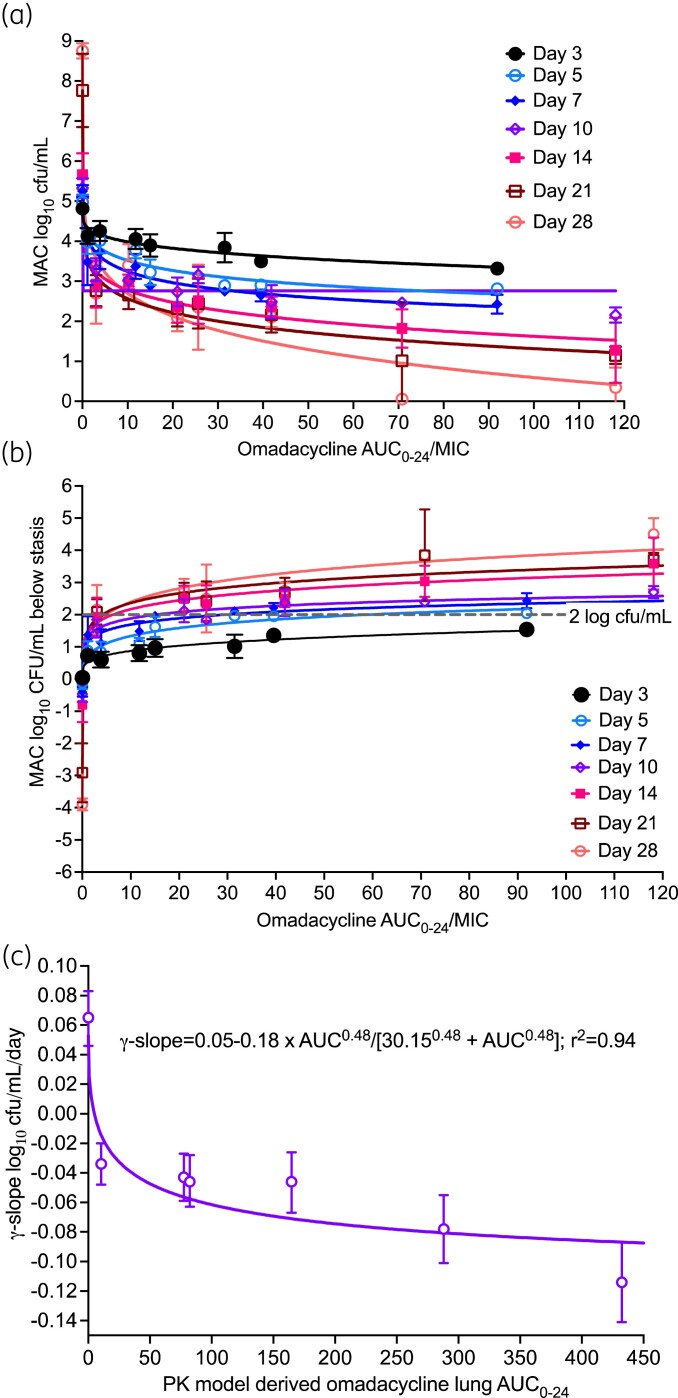
Figure 4.
Traditional versus γ-slope-based pharmacokinetics/pharmacodynamics approaches for omadacycline. (a and b) Symbols are mean log10 cfu/mL and error bars are standard deviation; on days 3 and 7 the datapoints for the higher AUC MIC exposures were automatically eliminated by the program as outliers. Three important findings are the change of Emax, EC50, and Econ with each sampling day. Particularly, in (b), the 2.0 log10 cfu/mL kill is achieved at different exposures depending on sampling day and the exposure value varies almost 50-fold depending on which day is used for the regression. (c) The error bars show the 95% CI. In the γ-slope-base pharmacokinetics/pharmacodynamics modelling, a single equation and single set of parameter estimates summarized all data points. This figure appears in colour in the online version of JAC and in black and white in the print version of JAC.

