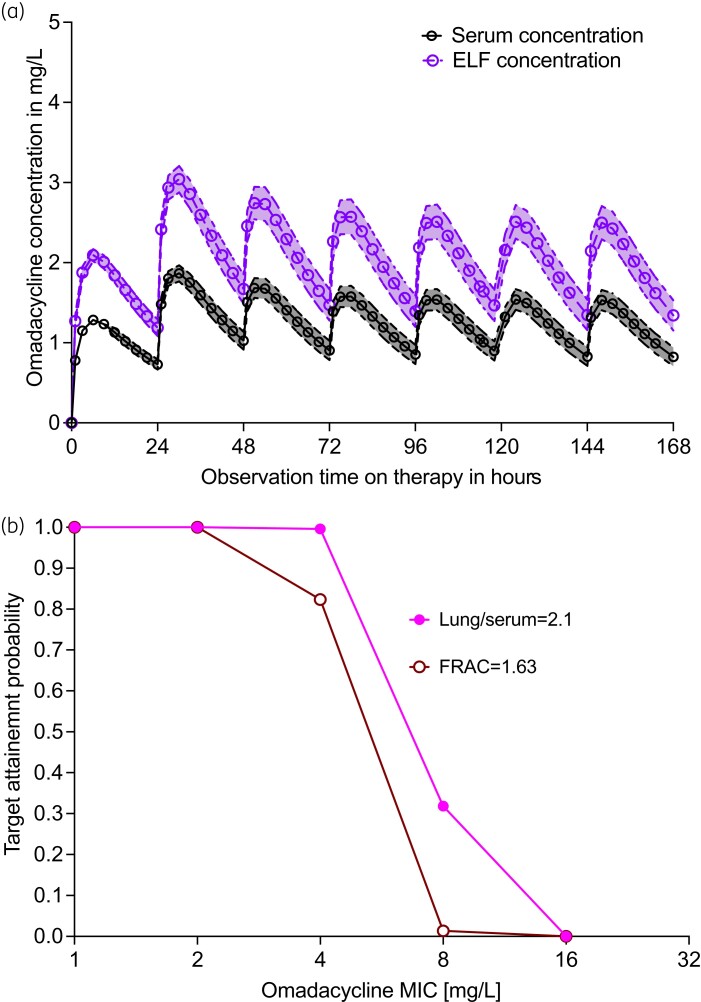
Figure 5.
Monte Carlo experiments in 10 000 subjects treated with standard dose omadacycline. (a) Symbols are mean concentrations and shaded area is the 95% CI. Concentration–time profiles in the first week are shown for serum and in the lung. (b) Target attainment probability for 10 000 patients showing proportion of patients who achieve target AUC/MIC exposures under two different drug penetration criteria. This figure appears in colour in the online version of JAC and in black and white in the print version of JAC.

