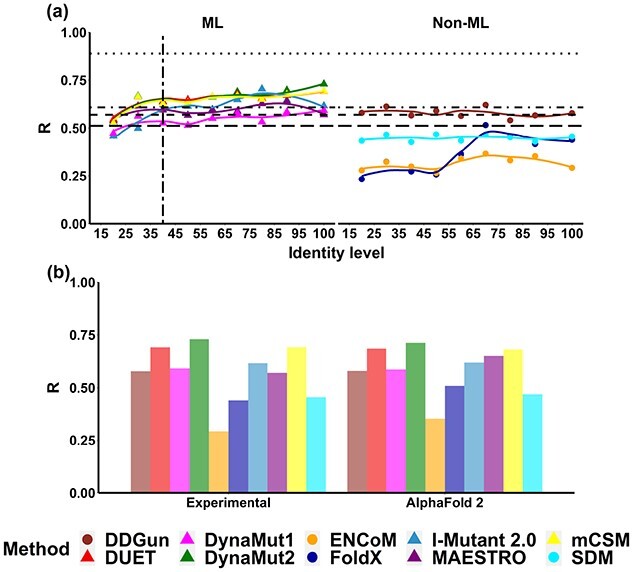
Figure 3.

Overall performance trends based on Pearson’s correlation coefficient (R) of ten methods predicting mutation effects on protein stability, namely DDGun (brown), DUET (red), DynaMut1 (pink), DynaMut2 (green), ENCoM (orange), FoldX (blue), I-Mutant 2.0 (light blue), MAESTRO (purple), mCSM-Stability (yellow) and SDM (cyan). The R values and their trends on homology models are represented in dots and lines, respectively. A vertical long-dashed line indicates the proposed identity cutoff for homology modelling, whereas the horizontal lines are the baseline performance of four sequence-based methods, namely SAAFEC-SEQ (dotted), MUpro (dot-dashed), I-Mutant (dashed) and DDGun (long-dashed).
