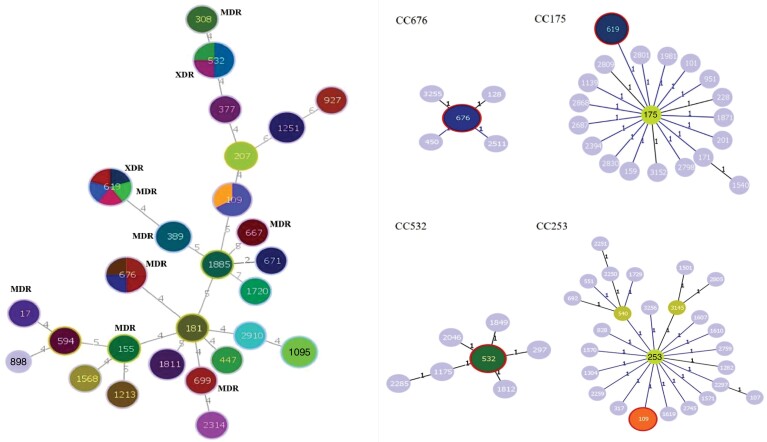
Figure 6.
Minimum spanning tree of the 43 P. aeruginosa strains based on the MLST allelic profile and main CCs. Each circle represents a clone. The size of the circle corresponds to the number of isolates ascribed to that particular clone and each different colour inside the circle represents a different antimicrobial profile associated with each clone.

