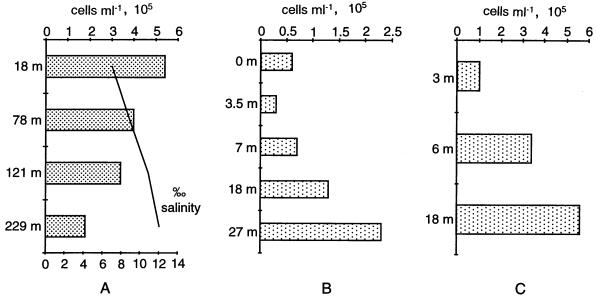
FIG. 1.
(A) Depth profile from the Baltic Sea. The bars show the total abundances of members of the beta subclass of the proteobacteria as revealed with probe BET42a. The line indicates the salinity. (B and C) Depth profiles from Lake Grosser Ostersee (B) and Lake Lago di Cadagno (C). The bars show the total abundances of the Cytophaga-Flavobacterium group as revealed with probe CF319a.

