Figure 1.

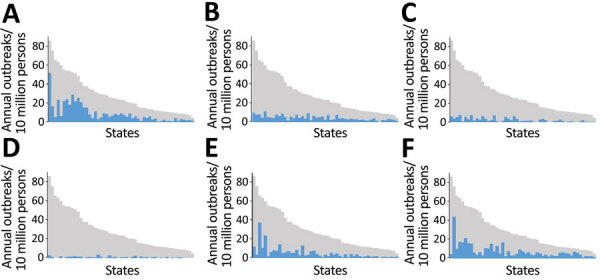
Mean annual rates of foodborne disease outbreaks reported to the Centers for Disease Control and Prevention per 10 million population by etiology and US state (deidentified), Foodborne Disease Outbreak Surveillance System, United States, 2009–2018. Blue bars represent outbreaks reported for the specified etiology. Gray bars represent all outbreaks reported. Blue and gray bars correspond to the same reporting jurisdiction and are ordered by reporting rate for all single-state outbreaks. A) Norovirus; B) Salmonella; C) bacterial toxins; D) Shiga toxin–producing E. coli O157; E) Other known cause; F) Unknown cause.
