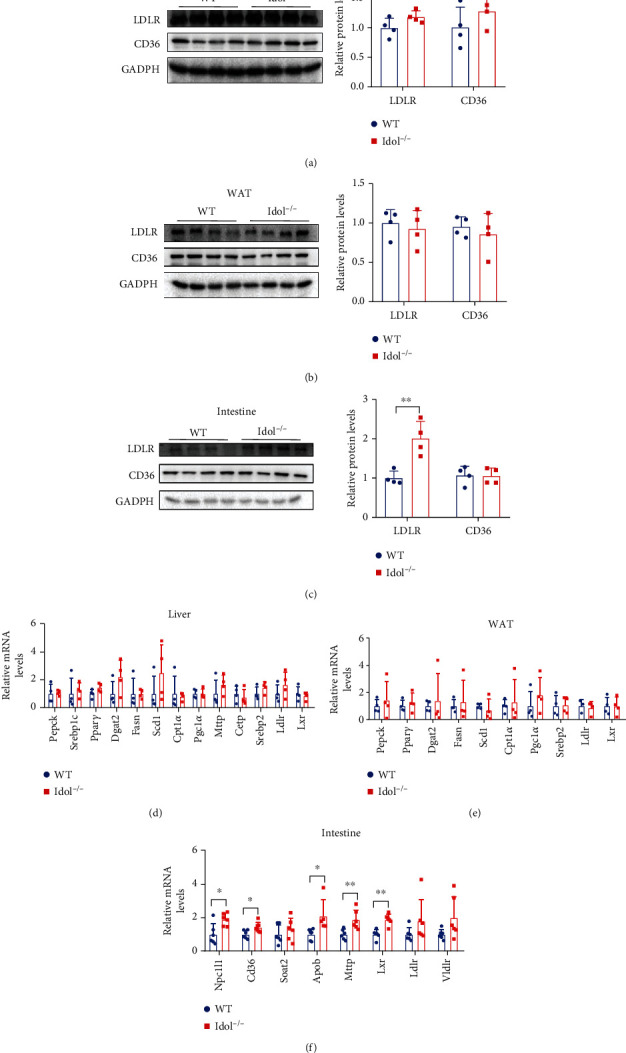
Figure 2.

Tissue-specific modulation of LDLR expression in WT and Idol−/− hamsters. (a–c) Western blotting and quantitative analysis of LDLR and CD36 protein expression in the liver (a), white adipose tissue (b), and small intestine (c). n = 4/group, ∗∗p < 0.01. (d–f) Relative mRNA expression levels of genes regulating lipid metabolism in the liver (d), white adipose tissue (e), and small intestine (f). n = 4/group in (d) and (e); n = 6-7/group in (f).
