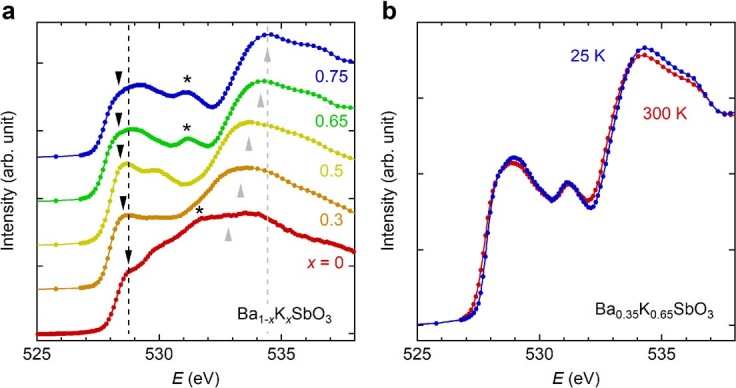
Extended Data Fig. 3. The oxygen K-edge X-ray absorption spectra of Ba1-xKxSbO3 (0 ≤ x ≤ 0.75).

a, The spectra of the BKSO samples with various K contents were measured at 300 K in the total fluorescence yield mode. All the samples show the pre-peak structure (black arrows) analogous to the Ba0.35K0.65SbO3 sample depicted in Fig. 4d. This indicates a strong admixture of Sb 5s with O 2p throughout the entire x range, but the intensity of the pre-peak is appreciably reduced compared with that of BKBO at comparable x values41,42,55. The position of the pre-peak shifts to a lower energy with increase of x, which can be understood as the suppression of the CDW gap by doping holes41,55. The high-energy peak (grey arrows) shifts to a higher energy, which may be associated with the Ba 5d and K 3d states that change upon the chemical substitution41. For the x = 0, 0.65, and 0.75 samples, the extra peak around 531 eV (black asterisks) likely originates from a degraded surface, because of its pronounced intensity in the surface-sensitive total electron yield mode data (not shown). Further quantitative analysis has so far been limited at present, as the Sb M5-edge gives rise to an additional structure around the pre-peak because its energy is so close to that of the oxygen K-edge56. b, The spectra of the x = 0.65 sample at 300 and 25 K, showing no apparent change within the temperature range investigated. We note that the x = 0.65 sample shown here is different from that in Fig. 4d.
