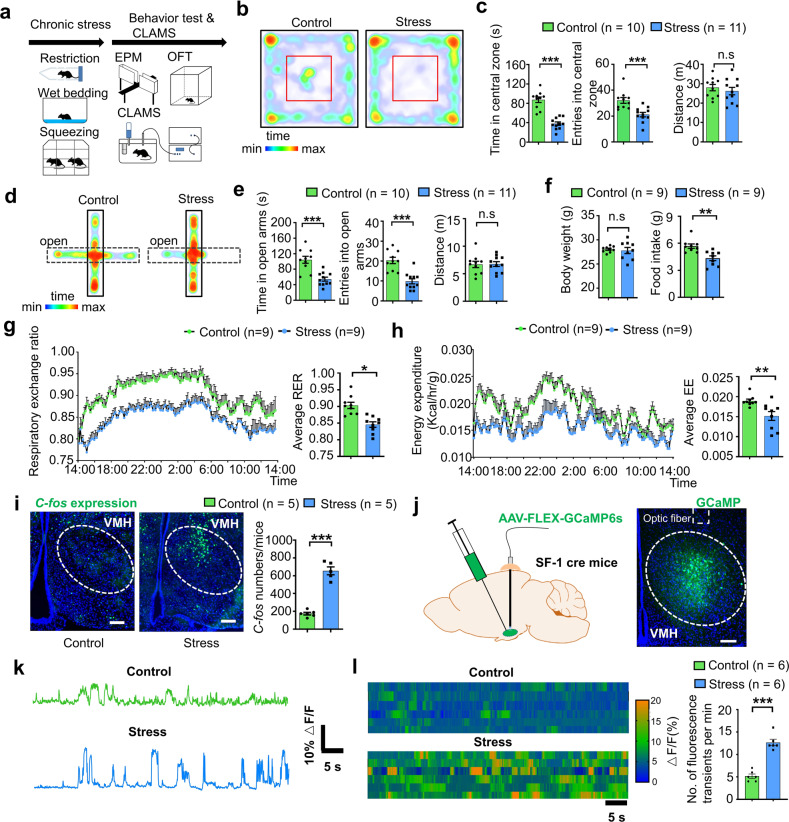
Fig. 1. Stressed mice exhibited anxiety-like behavior, altered metabolism, and enhanced neural activity in dmVMH.
a Illustration of unpredictable chronic stress protocol and phenotype assessment, with one stressor treatment randomly chosen per day, lasting for 4 weeks. b Residence time in each site of open field (blue, less time; red, more time). c Behavioral analysis of control (n = 10) and stress group mice (n = 11) in open field test showed significant decrease in both time spent in central area (unpaired Student’s t-test, P < 0.0001) and entries into central area in stress group (unpaired Student’s t-test, P = 0.0009), but no obvious change in traveling distance between groups (unpaired Student’s t-test, P = 0.4896). d Residence time in each site of elevated plus-maze (blue, less time; red, more time) of control and stress groups. e Control (n = 10) and stress groups (n = 11) in elevated plus-maze showed significant decrease in time spent in open arm (unpaired Student’s t-test, P < 0.0001) and entries into open arm in stress group (unpaired Student’s t-test, P < 0.0001), but no obvious change in traveling distance between groups (unpaired Student’s t-test, P = 0.9215). f Body weight monitored after chronic stress period showed no obvious change compared with control group (n = 9 in each group, unpaired Student’s t-test, P = 0.7125), and 24-h food intake after overnight fasting decreased in stress group (n = 9, unpaired Student’s t-test, P = 0.0014) compared with control group (n = 9). g Average respiration exchange ratio (RER) decreased in stress group compared with control group (unpaired student’s t-test, P = 0.0003, n = 9 mice in each group); RER curve shifted after chronic stress (two-way ANOVA, P = 0.0002, F (1, 16) = 21.95, with Bonferroni correction). h Significant decreases in 24-h energy expenditure (EE) curve and average EE were observed in stress group (two-way ANOVA, P = 0.0057, F (1, 16) = 20.2, with Bonferroni correction; unpaired Student’s t-test; P = 0.0060). i Increased c-fos expression in dmVMH under chronic stress (unpaired Student’s t-test, P < 0.001, n = 5 mice in each group). Scale bar, 100 µm. j Schematic of GCaMP6s injection and expression in VMH SF-1 neuron. Scale bar, 100 µm. k, l Representative in vivo calcium fluorescence traces and heat maps demonstrate enhanced spontaneous calcium signals (dF/F) of SF-1 neurons in mice of stress group compared with control (6 mice in each group, unpaired Student’s t-test, P < 0.001). Data are means ± SEM. *P < 0.05, **P < 0.01, ***P < 0.001. CLAMS comprehensive laboratory animal monitoring system.

