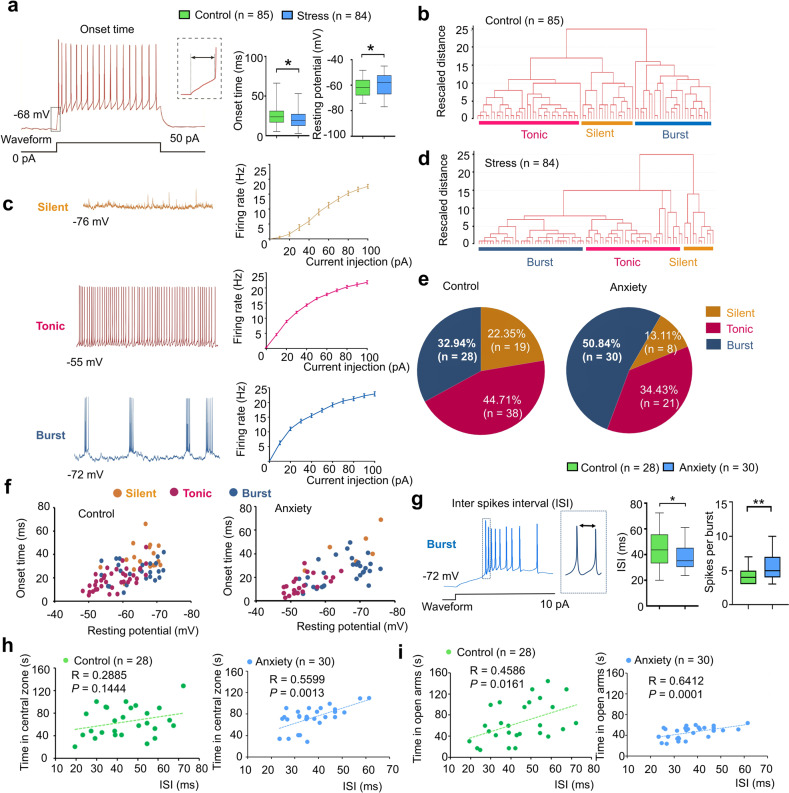
Fig. 2. Chronic stress-induced enhancement of burst firing in dmVMH neurons.
a Decreased average onset time (unpaired Student’s t-test, P = 0.0233) and depolarized average resting membrane potential (RMP) (unpaired Student’s t-test, P = 0.0434) in 84 dmVMH neurons from stressed mice compared with 85 neurons from wild-type control mice. b Cluster analysis of 85 dmVMH neurons from 35 control mice. Dendrogram of cluster analysis shows that dmVMH neurons could be classified into three subtypes: i.e., silent, tonic-firing, and bursting. c Electrophysiological properties of silent, tonic-firing, and bursting dmVMH neuronal subtypes. left: whole-cell recording traces of three neuronal subtypes without current injection; right: frequency-current curve of three subtypes at current injections of 0–100 pA and 10 pA/step. d Cluster analysis of 84 dmVMH neurons from 39 stressed mice. Dendrogram of cluster analysis shows these dmVMH neurons can be classified into three subtypes: i.e., silent (n = 11), tonic-firing (n = 35), and bursting (n = 38). e Pie chart of percentages of neuronal dmVMH subtypes in control group and stressed mice with obvious anxiety-like behavior (anxiety group). f Distribution of 85 dmVMH neurons in control mice (left) and 57 dmVMH neurons in anxiety group (right) using onset time-RMP coordinate system, which represents shorter average onset time and more depolarized average RMP caused by changes in proportion of three subtypes. g Inter-spike interval (ISI) of bursts in dmVMH neurons of control and stressed mice. Left, Example of burst firing and ISI; right, ISI of burst firing dmVMH neurons (n = 30) in anxiety group decreased significantly compared with that in control group (n = 28), and burst of anxiety group exhibited more spikes (unpaired Student’s t-test, ISI: P = 0.0173, spikes in each burst, P = 0.0036). h, i ISI of dmVMH bursting neurons in anxiety group (stressed mice which displayed obvious anxiety behavior) exhibits higher correlation with the residing time in open arms of EPM and central area of open field, compared with that in control group (control group: n = 28 cells from 21 mice; anxiety group: n = 30 cells from 20 mice). The box plotted at the median extending from the 25 to 75th percentile, and the whisker represents Min to Max distribution. Data are means ± SEM *P < 0.05, **P < 0.01.

