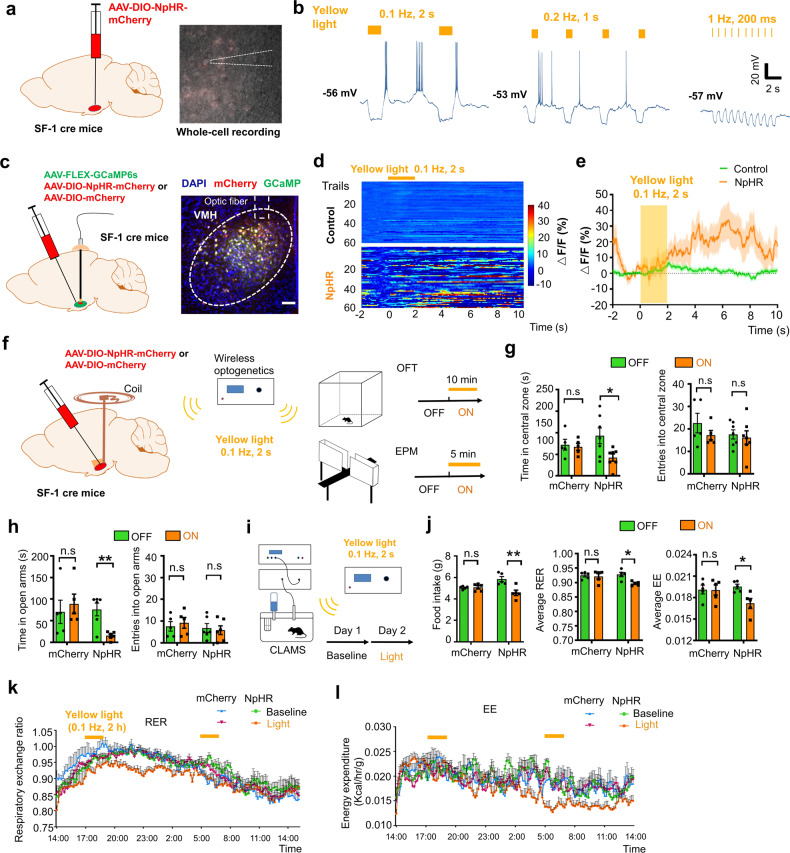
Fig. 3. Optogenetic activation of burst firing neurons in dmVMH induced anxiety-like behavior and energy expenditure changes.
a Schematic of dmVMH injection of NpHR AAV viral vector to induce burst firing in vivo. b Whole-cell recordings of yellow light-evoked burst firing in brain slices (yellow light: 590 nm, left: 0.1 Hz, 2 s; middle: 0.2 Hz, 1 s; right: 1 Hz, 200 ms), 0.1 Hz successfully induced activation of burst firing neurons in dmVMH. c Schematic of dmVMH injection of NpHR AAV and GCaMP6s AAV viral vector in SF-1 cre mice to achieve in vivo photometry recording and optogenetic manipulation. Scale bar, 100 µm. d Heatmaps demonstrate GCaMP6s fluorescence change induced by optogenetically induced burst firing (60 trails from 3 mice in each group). e Average traces of calcium fluorescence responses in VMH evoked by yellow light. f Illustration of wireless optogenetic manipulation of dmVMH neurons and behavioral test strategies in free-moving mice. g Open field tests before and during light illumination: residence time in central area decreased during 10-min yellow light illumination in NpHR group (n = 7, paired Student’s t-test, P = 0.0210), but not control group (n = 5, paired Student’s t-test, P = 0.4587). No significant effect of light stimulation was observed on number of entries into central area in two groups (paired Student’s t-test, control group: P = 0.3915; NpHR group: P = 0.5327). h Residence time in open arms decreased only in NpHR group (paired Student’s t-test, control group: n = 5, P = 0.6382; NpHR group: n = 6, P = 0.0036); No obvious changes in number of entries into open arms observed during “light-on” period in two groups (paired Student’s t-test, control group: P = 0.4908; NpHR group: P = 0.7060). i Schematic of CLAMS experiments on free-moving mice with wireless optogenetic manipulation of dmVMH neurons, 0.1-Hz yellow light illumination at the start of the test period at Day 2 for 2 h and repeated the stimulation after 12 h. j Food intake and energy expenditure were monitored during optogenetic manipulation of dmVMH neurons in free-moving mice. Food intake decreased during light stimulation in NpHR group (paired Student’s t-test, control group: P = 0.6240; NpHR group: P = 0.0038, n = 5 mice in each group), also average RER (paired Student’s t-test, control group: P = 0.7058; NpHR group: P = 0.0176) and EE (paired Student’s t-test, control group: P = 0.9502; NpHR group: P = 0.0383) decreased in NpHR group. k–l 24-h-RER and EE curve of NpHR group in Day 2 (0.1 Hz, 2 s yellow light; lasting for 2 h/trial, 2 trials) shifted compare with baseline. (two-way ANOVA, RER: P = 0.0053, F (1, 8) = 14.38; EE: P = 0.0143, F (1, 8) = 9.699, with Bonferroni correction), and no significant change occurs in control group (two-way ANOVA, RER: P = 0.7709, F (1, 8) = 0.0907; EE: P = 0.9457, F (1, 8) = 0.0049, with Bonferroni correction). Data are means ± SEM; *P < 0.05, **P < 0.01.

