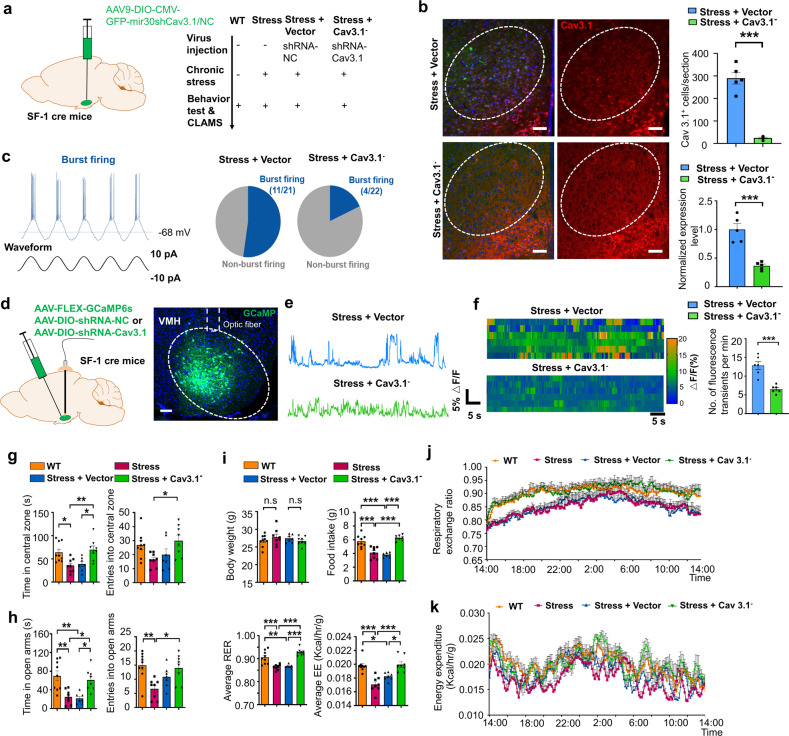
Fig. 5. Knockdown of Cav3.1 in dmVMH decreased burst firing, and rescued anxiety-like behavior and metabolic alteration induced by chronic stress.
a Schematic demonstrates injection of DIO-based shRNA-expressing AAV viral vector into dmVMH of SF-1 cre mice to interfere with Cav 3.1 expression. b Immunostaining of Cav 3.1 in stressed mice injected with shRNA-NC (negative control) or shRNA-Cav3.1 AAV vector. Scale bar is 100 μm. Cell counting (right, up) and gene expression analysis (right bottom) indicated an effective knock-down of Cav3.1 expression in stress + Cav3.1− group (Cav3.1+ cells counting, unpaired Student’s t-test, P < 0.001; Q-PCR, unpaired Student’s t-test, P < 0.001). c Proportion of burst firing neurons decreased in stress + Cav3.1− group (4/22) compared with stress + vector group (11/21). d Schematic of injection of GCaMP6s AAV viral vector into dmVMH of SF-1 cre mice to achieve in vivo photometry recording. Scale bar, 100 µm. e Representative traces of spontaneous calcium transients in VMH of stress + vector and stress + Cav3.1− groups. f Heatmaps demonstrate different spontaneous GCaMP6s fluorescence signals in stress + vector and stress + Cav3.1− groups (6 mice in each group, unpaired Student’s t-test, P < 0.001). g Time spent in central area and number of entries into central area of open field in WT, stress, stress + vector and stress + Cav3.1− groups. Residence time: P = 0.0024; WT (n = 9) versus stress group (n = 8), P = 0.0324; stress + vector (n = 7) versus stress + Cav3.1− group (n = 8), P = 0.0261; stress versus stress + Cav3.1− group, P = 0.0084. Number of entries: P = 0.0024; WT versus stress group, P = 0.1795; stress + vector versus stress + Cav3.1− group, P = 0. 2843; stress versus stress + Cav3.1− group, P = 0.0433. (one way ANOVA, with Bonferroni correction). h Time spent in open arms and number of entries into open arms of elevated plus-maze in WT, stress, stress + vector and stress + Cav3.1− groups. Residence time: P = 0.0002; WT (n = 9) versus stress group (n = 8), P = 0.0019; stress + vector (n = 7) versus stress + Cav3.1− group (n = 8), P = 0.0142; WT versus stress + vector group: P = 0.0013; stress versus stress + Cav3.1− group, P = 0.0219. Number of entries: P = 0.0025; WT versus stress group, P = 0.0031; stress + vector versus stress + Cav3.1− group, P = 0.9999; stress versus stress + Cav3.1− group, P = 0.0121 (one way ANOVA, with Bonferroni correction). i No significant differences in average body weights of WT, stress, stress + vector and stress + Cav3.1− groups were observed after 4 weeks of chronic stress (P = 0.4755); WT (n = 9) versus stress group (n = 8), P = 0.9999; stress + vector (n = 7) versus stress + Cav3.1− group (n = 8), P = 0.9999; Food intake: P < 0. 0001; WT versus stress group, P = 0.0001; stress + vector versus stress + Cav3.1− group, P < 0.0001; WT versus stress + vector group, P < 0.0001; stress versus stress + Cav3.1− group, P < 0.0001. Average RER: P < 0.0001; WT versus stress group, P = 0.0003; stress + vector versus stress + Cav3.1− group, P < 0.0001; WT versus stress + vector group, P = 0.0016; stress versus stress + Cav3.1− group, P < 0.0001. Average EE: P < 0.0001; WT versus stress group, P < 0.0001; stress + vector versus stress + Cav3.1− group, P = 0.0112; WT versus stress + vector group, P = 0.0189; stress versus stress + Cav3.1− group, P < 0.0001 (one way ANOVA with Bonferroni correction). j, k 24-h RER and EE curve of WT, stress, stress + vector and stress + Cav3.1− groups; For RER: two-way ANOVA: WT versus stress group, P = 0.0251, F(1, 15) = 6.186; stress + vector versus stress + Cav3.1− group, P = 0.0289, F(1, 13) = 6.027; 8 mice in each group; For EE: two-way ANOVA: WT versus stress group, P < 0.001, F(1, 15) = 31.40; stress + vector versus stress + Cav3.1− group, P = 0.0062, F(1, 13) = 10.654). All two-way ANOVA are performed with Bonferroni correction. Data are means ± SEM, *P < 0.05, **P < 0.01, ***P < 0.001.

