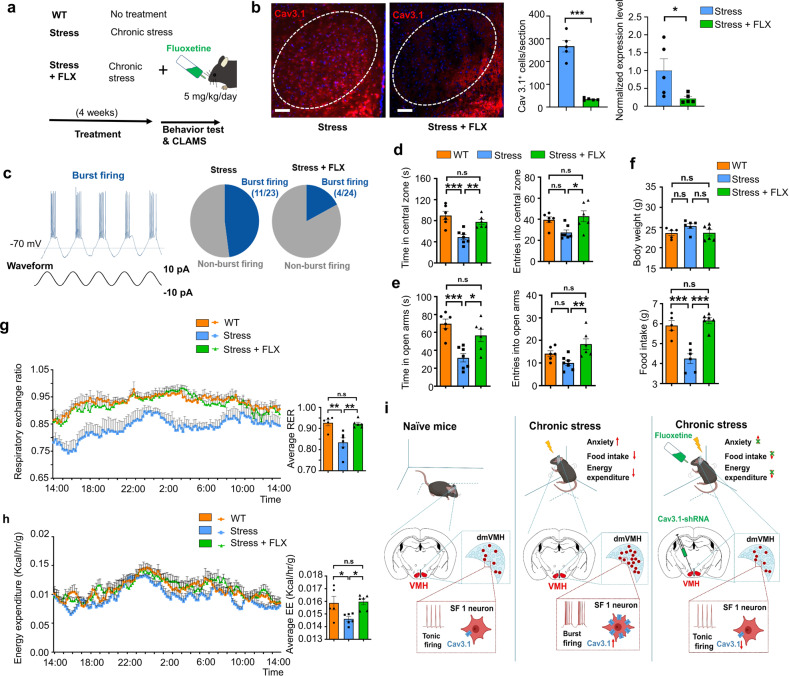
Fig. 6. Anxiolytics suppressed Cav3.1 expression and burst firing in VMH, and rescued anxiety-like behavior and metabolic alteration induced by chronic stress.
a Schematic demonstrates fluoxetine application and related experimental strategy. b Immunostaining of Cav 3.1 in mice undergo chronic stress alone or chronic stress plus fluoxetine treatment. Scale bar is 100 μm. Quantification of Cav3.1 expression (right) in these two groups (Cav3.1+ cells counting, unpaired Student’s t-test, P < 0.001; qRT-PCR, Mann–Whitney test, P = 0.0397). c Proportion of burst firing neurons decreased in stress + FLX (fluoxetine) group (4/24) compared with stress group (11/23). d Time spent in central area and number of entries into central area of open field in WT, stress, and stress + FLX groups. Residence time: P = 0.0004; WT (n = 6) versus stress group (n = 7), P = 0.0004; stress versus stress + FLX group (n = 6), P = 0.0091. Number of entries: P = 0.0160; WT versus stress group, P = 0.0827; stress versus stress + FLX group, P = 0.0209 (one way ANOVA with Bonferroni correction). e Time spent in open arms and number of entries into open arms of elevated plus-maze in WT, stress, and stress + FLX groups. Residence time: P = 0.0006; WT (n = 6) versus stress group (n = 7), P = 0.0005; stress versus stress + FLX group (n = 6), P = 0.0169. Number of entries: P = 0.0075; WT versus stress group, P = 0.2547; stress versus stress + FLX group, P = 0.0062 (one way ANOVA with Bonferroni correction). f No significant differences in average body weights of WT, stress, and stress + FLX groups were observed after 4 weeks of treatments, P = 0.1334; WT (n = 5) versus stress group (n = 6), P = 0.1890; stress versus stress + FLX group (n = 6), P = 0.1869. Food intake of mice in WT, stress, and stress + FLX group: P < 0.0001; WT versus stress group, P = 0.0003; stress versus stress + FLX group, P < 0.0001. (one way ANOVA with Bonferroni correction). g, h 24-h RER and EE curve of WT, stress and stress + FLX groups; For RER: two-way ANOVA: WT versus stress group, P = 0.0060, F(1, 9) = 12.8; stress versus stress + FLX group, P = 0.0030, F(1, 10) = 15.19; For EE: two-way ANOVA: WT versus stress group, P = 0.0375, F(1, 9) = 5.939; stress versus stress + FLX group, P = 0.0010, F(1, 10) = 20.89. Average RER of WT, stress, and stress + FLX group: one way ANOVA with Bonferroni correction, P = 0.0013; WT versus stress group, P = 0.0034; stress versus stress + FLX group, P = 0.0036. Average EE of WT, stress, and stress + FLX group: one way ANOVA with Bonferroni correction, P = 0.0169; WT versus stress group, P = 0.0463; stress + vector versus stress + FLX group, P = 0.0230. i Schematic showing that chronic stress enhanced burst firing and Cav3.1 expression in dmVMH neurons to induce the anxiety-like behavior and energy expenditure changes, which could be rescued by knocking down of Cav3.1 or application of anxiolytics. All two-way ANOVA are performed with Bonferroni correction. Data are means ± SEM, *P < 0.05, **P < 0.01, ***P < 0.001.

