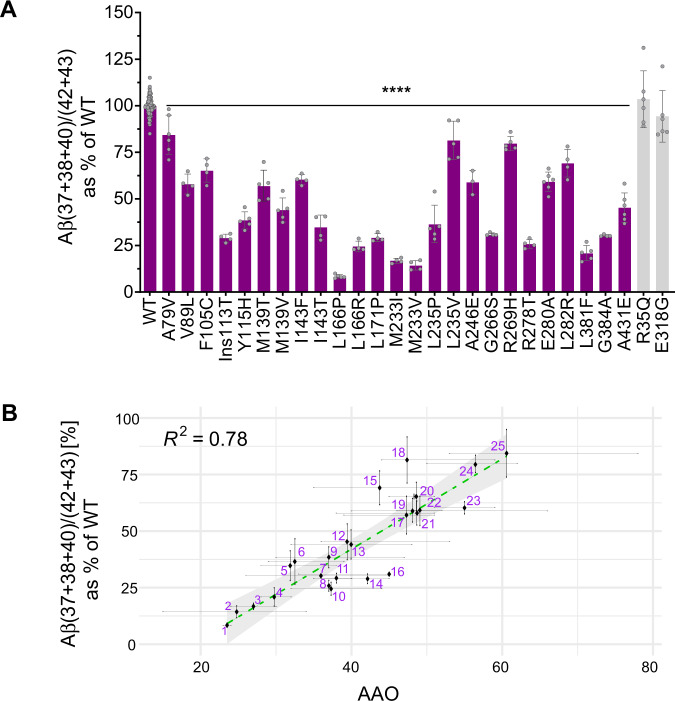
Fig. 2. Changes in Aβ profile composition -linked to pathogenic PSEN1 mutants- correlate linearly with AAO.
A The efficiency of the 4th enzymatic turnover of APPC99 quantified by the Aβ (37 + 38 + 40) / (42 + 43) ratio. Data are represented as mean ± SD, N ≥ 4 independent experiments. One-way ANOVA followed by Dunnett’s post-hoc test with comparison to wild type was used to determine statistical significance (p < 0.05); ****p < 0.0001, (F(DFn, DFd): F (27, 185) = 200.6); (B) Correlative analysis between AAO and Aβ (37 + 38 + 40) / (42 + 43) ratio (efficiency of the 4th catalytic turn-over) (Y = 1.996*X - 37.8). The 95% confidence interval (light grey surface) and correlation coefficient (R2) are shown. The error bars present SD and range for Aβ ratio and AAO, respectively.

