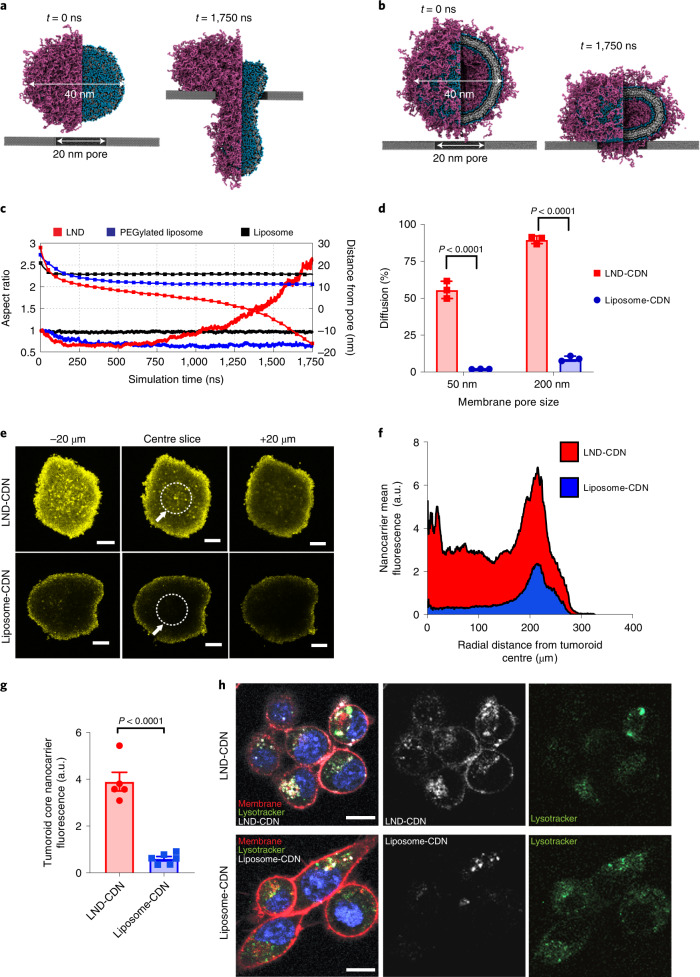
Fig. 2. LND-CDN shows superior passive diffusion and tumour penetration compared with liposome-CDN in vitro.
a,b, Coarse-grained simulation snapshots of an LND (a) and a PEGylated liposome (b), both with a diameter of 40 nm, before (t = 0 ns) and after (t = 1,750 ns) being pulled through a 20 nm pore by a force of 200 kJ mol−1 nm−1. Purple beads represent PEG polymers; blue, black and white beads correspond to lipid headgroups, glycerol groups and hydrophobic tails, respectively. c, Computed aspect ratio (lines) and distance of the particle centroid from the pore (squares) of LND, PEGylated liposome and bare liposome systems as a function of pulling simulation time. d, LND-CDN or liposome-CDN were added to a diffusion chamber at 0.5 µM (CDN concentration) separated from a receiver chamber by a 6 µm thick membrane with the indicated pore size and incubated at 25 °C. Shown is the percentage of particles detected in the receiver chamber after 24 h (mean ± s.e.m.). e–g, Fluorescent LND-CDN or liposome-CDN were added to the medium of wells containing MC38 tumour spheroids at 5 μM (CDN concentration) for 24 h, followed by washing to remove particles from the medium and imaging of particle penetration into spheroids by confocal microscopy (n = 5 independent spheroids for LND-CDN and n = 6 independent spheroids for liposome-CDN): representative spheroid z-stack images from the centre focal plane analysed and focal planes 20 µm above and below (e); radial distribution plots of nanocarrier fluorescence (f); and mean particle signal (±s.e.m.) measured in the central 100 µm radius core of spheroids (g, core region denoted by white dotted line and white arrow in e). h, MC38 cells were incubated for 4 h with 5 µM fluorescent liposome-CDNs or LND-CDNs, stained with membrane/nuclear (DAPI)/endosolysosomal (lysotracker) markers, and imaged by confocal microscopy. Shown are representative images from one of two independent experiments. Scale bars, 10 µm. Statistical comparisons in d and g performed using an unpaired, two-tailed Student’s t-test.

