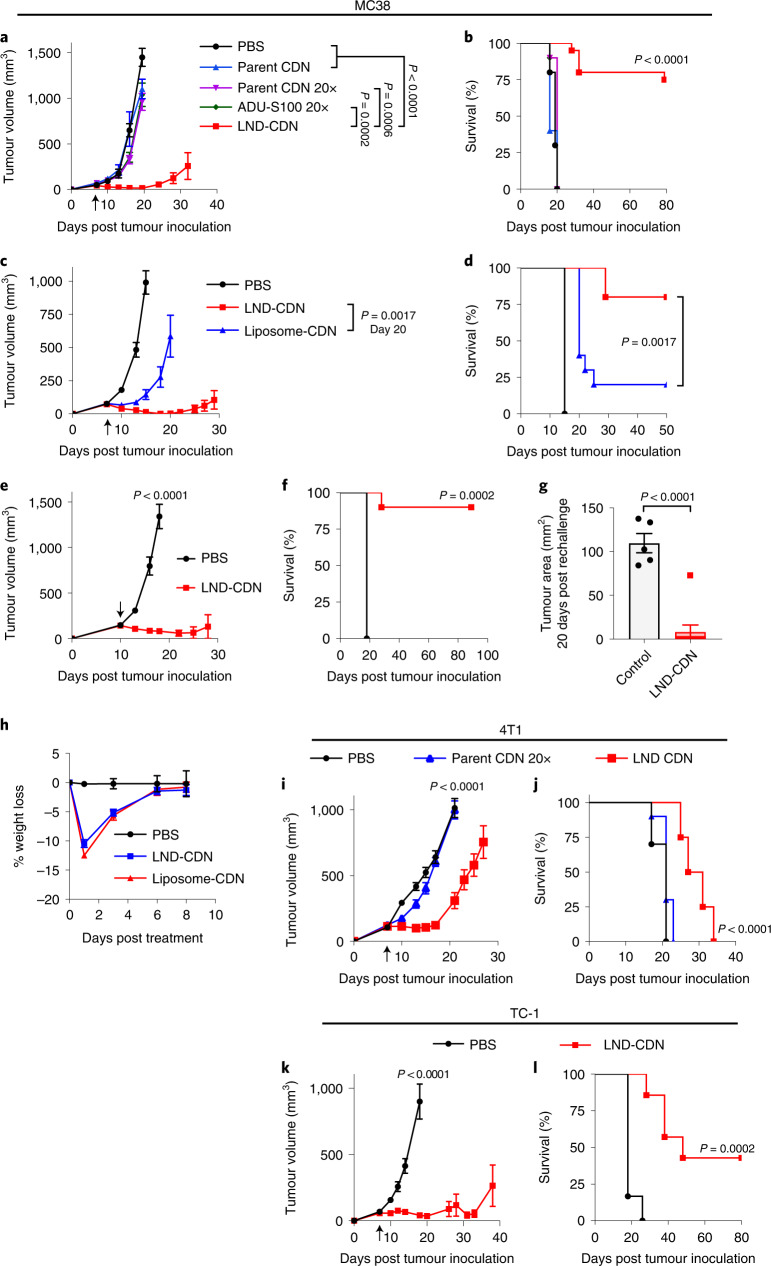
Fig. 4. A single dose of LND-CDN shows therapeutic efficacy in multiple syngeneic tumour models.
a–d, C57Bl/6 mice were inoculated with 5 × 10⁵ MC38 tumour cells and then treated on day 7 with intravenous administration of PBS vehicle (n = 10), parent CDN (5 nmol per mouse, n = 5), parent CDN (100 nmol per mouse, n = 10), ADU-S100 (100 nmol per mouse, n = 10) or LND-CDN (5 nmol per mouse, n = 20): tumour size (a, mean ± s.e.m) and overall survival (b); or PBS vehicle (n = 9), LND-CDN (5 nmol per mouse, n = 10) or liposome-CDN (5 nmol per mouse, n = 10): tumour size (c, mean ± s.e.m.) and overall survival (d). e,f, Mice with MC38 tumours as in a were treated on day 10 with PBS vehicle (n = 5) or LND-CDN (5 nmol per mouse, n = 10): tumour growth (e) and survival (f). g, Mice (n = 9 animals per group) that rejected their tumour following treatment in e,f were rechallenged with 5 × 10⁵ MC38 tumour cells 90 d following the initial tumour inoculation on the opposite flank and tumour growth was assessed 20 d later (mean ± s.e.m.), compared to naive age-matched control mice (n = 5) given the same tumour challenge. h, C57Bl/6 mice bearing MC38 tumours (n = 5 animals per group) were treated as in c and animal weights were tracked over time. i,j, Tumour growth (i, mean ± s.e.m.) and survival (j) curves of BALB/c mice (n = 10 animals per PBS and parent CDN groups, n = 8 animals per LND-CDN group) implanted orthotopically in the mammary fat pat with 5 × 10⁵ 4T1-Luc tumour cells and then treated intravenously on day 7 with PBS vehicle, parent CDN (200 nmol) or LND-CDN (10 nmol). k,l, C57Bl/6 mice were inoculated in the flank with 3 × 10⁵ TC-1 tumour cells and treated intravenously on day 7 with PBS vehicle (n = 6) or LND-CDN (5 nmol, n = 7): shown are tumour growth (k, mean ± s.e.m.) and survival (l). Statistical comparisons among tumour sizes in a, c, e, i and k were tested using an ordinary one-way ANOVA with Tukey’s multiple-comparisons test and in g using an unpaired, two-tailed Student’s t-test. Statistical comparisons between survival curves were performed using a log-rank (Mantel–Cox) test.

