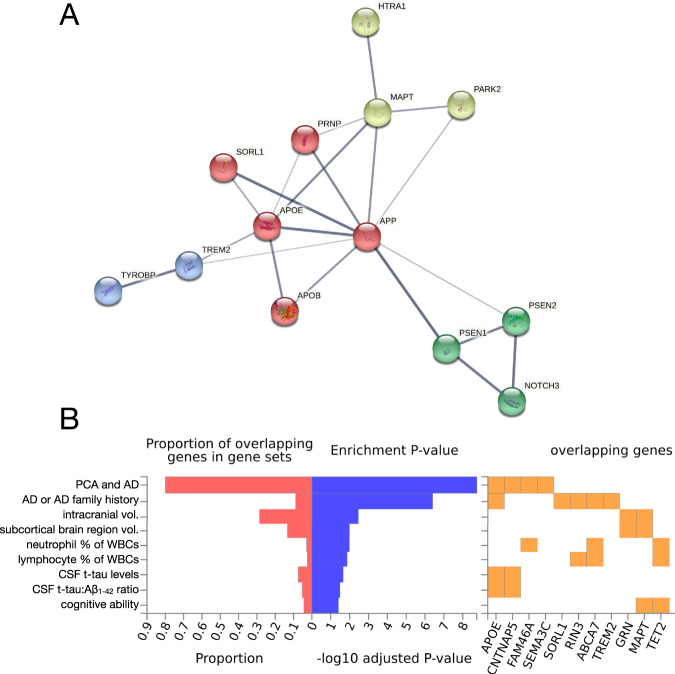
Fig. 4. Interaction network and GWAS enrichment analyses of early-onset Alzheimer’s disease-associated genes.
A A list of 26 EOAD- and PCA-associated genes1 was submitted for analysis via the STRING database (v 11.5; [238]) to visualize potential physical and functional interactions between the encoded proteins. The analysis recapitulated well-known interactions while also revealing an interaction between HTRA1 and MAPT, reflecting HTRA1’s ability to degrade aggregated and fibrillar tau [239, 240]. Further review of the literature reveals that HTRA1 is capable of degrading APP and APOE in addition to tau [241, 242]. This suggests that rare, deleterious variation within HTRA1 might increase EOAD risk (as suggested in [225]) not only via mechanisms related to CARASIL/CADASIL (i.e., in a manner analogous to NOTCH3 pathogenic variants), but also potentially via effects on tau, APP, or APOE metabolism. Querying the full STRING network with this gene set and limiting active interaction sources to experiments and databases, we obtained a protein–protein interaction enrichment p value of 1.1 × 10⁻¹⁶. Network edge thickness indicates the strength of the supporting data; nodes are colored according to cluster identity resulting from MCL clustering. B The same gene set was submitted to the FUMA GWAS platform (GENE2FUNC function; [243]) to determine whether EOAD- and PCA-associated genes were enriched in sets of significantly associated genes for a large number of GWAS phenotypes. The analysis revealed significant (pFDR < 0.05) enrichment for expected phenotypes (e.g., AD and family history of AD, PCA, CSF t-tau levels), but also revealed significant enrichments for phenotypes like intracranial volume, subcortical brain region volumes, relative neutrophil and lymphocyte abundance, and cognitive ability. A subset of the significant FUMA GWAS results were selected for display. 1Gene list: APP, PSEN1, PSEN2, APOE, APOB, SEMA3C, CNTNAP5, FAM46A, CCL11, MAPT, PRNP, GRN, C9orf72, SORL1, ABCA7, TREM2, TYROBP, PSD2, TCIRG1, RIN3, RUFY1, NOTCH3, HTRA1, CHCHD10, PARK2, and TET2 (all references provided within the main text).

