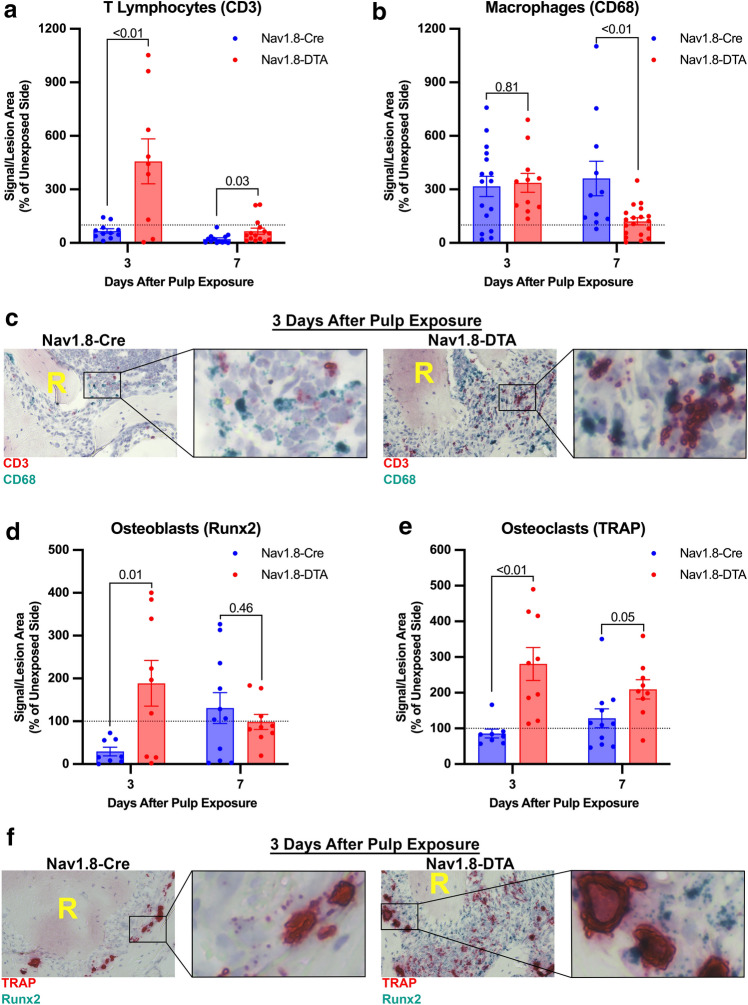
Fig. 4.
Nociceptor-ablation modulates mRNA expression of key immune and bone metabolism genes. Quantification of CD3+ T Lymphocytes at days 3 and 7 (a) (n = 8–16 per group). Quantification of CD68+ macrophages at days 3 and 7 (b) (n = 11–19 per group). Representative 40 × brightfield images of RNAscope staining for day 3 CD3+ T Lymphocytes (red) and CD68+ macrophages (green) for Nav1.8-Cre and Nav1.8-DTA mice (c). Quantification of Runx2+ osteoblasts at days 3 and 7 (d) (n = 8–11 per group). Quantification of TRAP+ osteoclasts at days 3 and 7 (e) (n = 8–11 per group). Representative 40 × brightfield images of RNAscope staining for day 3 TRAP+ osteoclasts (red) and Runx2+ osteoblasts (green) for Nav1.8-Cre and Nav1.8-DTA mice (f). Statistical analysis was performed using two-tailed unpaired t tests per target, per time point. Data are presented as area of signal per lesion area normalized to the contralateral side, and all graphs are shown as mean ± SEM

