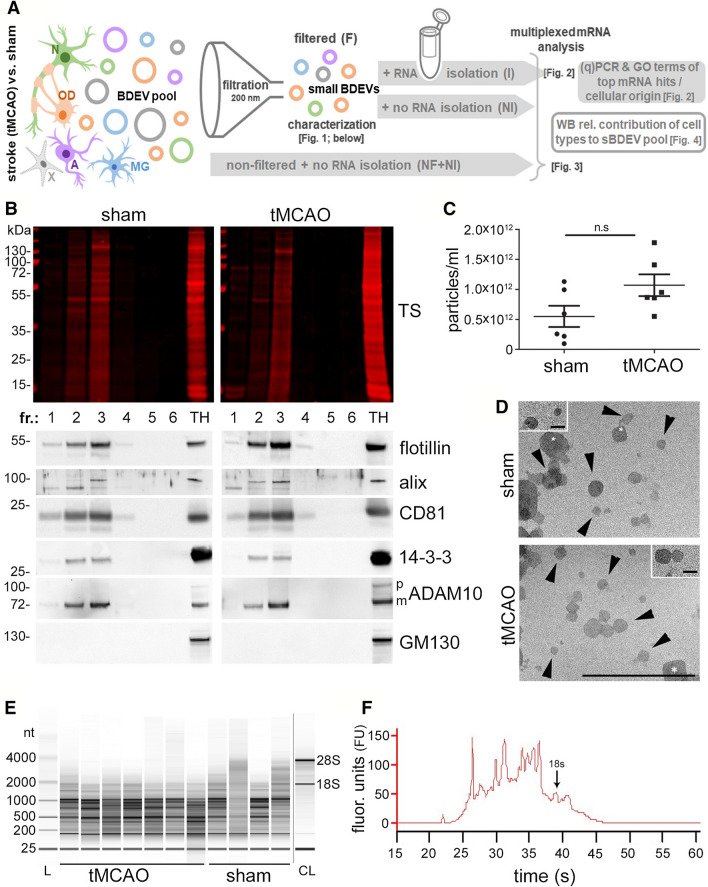
Fig. 1.
BDEVs characterization and mRNA isolation. A Overview of the research strategy and experimental workflow followed in the present study. Different cell types, including neurons (N, green), oligodendrocytes (OD, orange), astrocytes (A, pink), microglia (MG, blue), and others (X, grey) contribute to the EV pool in brain. EVs were purified from the brains of mice 72 h after experimental stroke (tMCAO) or a control procedure (sham). Small brain-derived EVs (sBDEVs) were obtained upon filtration (F) and characterized. The mRNA content of sBDEVs was assessed in detail for stroke and sham samples and compared with (I) or without (NI) a previous RNA isolation step. Moreover, a comparison was performed between filtered (F, sBDEVs) and non-filtered (NF) BDEVs (with the latter population also containing larger EV species). Lastly, changes in the relative contribution of different cell types to the EV pool upon stroke were assessed. Reference to respective figures showing the data is provided in brackets. B Western blot characterization of the six fractions obtained after sucrose gradient centrifugation. Fractions 2 and 3 are labeled with antibodies against EV markers flotillin, CD81, and 14–3-3 indicating enrichment of EVs. Moreover, presence in the same fractions of Alix and mature (m) ADAM10 indicates enrichment in exosomes. CD81 and flotillin are also found in fraction 4, therefore, fractions 2, 3, and 4 were pooled for the subsequent experiments. The Golgi protein GM130 is absent in the BDEVs fractions indicating a lack of contamination with intracellular organelles. TS is total protein staining. TH is a total brain homogenate of a WT mouse used only for comparison purposes. C Nanoparticle tracking analysis (NTA) of pooled BDEVs fractions (n = 6). Values are given in the main text. D Electron microscopy of BDEVs. Arrowheads point towards BDEVs, whereas the white asterisks mark structures that, for the shape, are not assignable to EVs and most likely represent some minor contamination by cell membrane fragments. The scale bar is 500 nm, 100 nm on the insert. E Example of the BDEVs-RNA profile obtained with the Bioanalyzer. Most of the RNA is under 1000 nt in both, tMCAO and sham BDEVs. CL is a cell lysate, used for comparison purposes as it shows the two main rRNAs (18S and 28S), which are mostly absent in BDEVs. F Representative electropherogram obtained with the Bioanalyzer showing the fluorescent units (FU) on the Y-axis and the migration time (in seconds, s) on the X-axis

