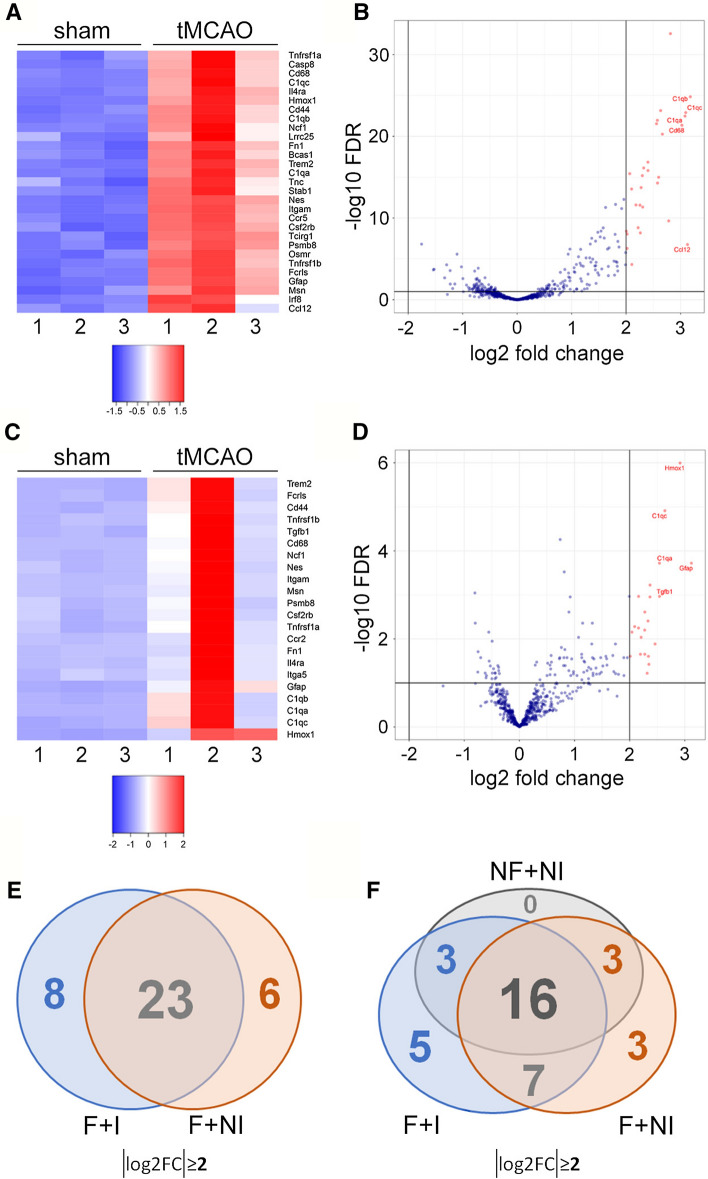
Fig. 3.
No major differences are observed for the highest upregulated BDEVs mRNAs in tMCAO compared to shams with and without mRNA isolation and with (i.e., sBDEVs) and without a filtration step (i.e., inclusion of BDEVs bigger than 200 µm). A Heat map showing the significantly up- and downregulated (absolute log2FC ≥ 2) mRNAs in (filtered) sBDEVs from tMCAO compared to shams (n = 3 per group) using the nCounter® panel without mRNA isolation (NI samples). B Volcano plot for the same mRNAs as in (A) displaying the names of the five highest significantly differentially expressed mRNAs in sBDEVs in tMCAO mice compared to shams. The exact log2FC values for these five mRNAs are C1qb: 3.18; Ccl12: 3.13; C1qc: 3.09; C1qa: 3.08; and Cd68: 3.02. The X-axis shows the log2FC, and the Y-axis the − log10 FDR. C Heat map of the most up- and downregulated mRNAs (absolut log2FC ≥ 2) mRNAs in BDEVs from tMCAO compared to shams (n = 3 per group) using the nCounter® panel without previous filter step in the BDEV harvest protocol and without RNA isolation (NF + NI). D Volcano plot for the same mRNAs as in (C) displaying the names of the five highest significantly differentially expressed mRNAs in BDEVs in tMCAO mice compared to shams. The exact log2FC values for these five mRNAs are Gfap: 3.12; Hmox1: 2.91; C1qc: 2.64; Tgfb1: 2.54; and C1qa: 2.54. E Overview of the most up- and downregulated mRNAs (absolut log2FC ≥ 2) displayed in a Venn diagram showing the number of the commonly shared versus the unique mRNAs for “F + I” samples (mRNA isolated from sBDEVs; see data in Fig. 2) compared to “F + NI” (mRNA not isolated from sBDEVs before running the nCounter® panel). EV filtration was performed in both instances (i.e., both panels assess mRNAs from sBDEVs). F Overview of the most up- and downregulated mRNAs (absolute log2FC ≥ 2) displayed in a Venn diagram showing the number of the commonly shared and the unique mRNAs of each studied condition (including non-filtered EVs without RNA isolation (NF + NI)). F = BDEV samples filtrated during preparation (sBDEVs); NF = BDEVs samples not filtrated during preparation (hence also containing larger EVs); I = mRNA was isolated from BDEVs; NI = mRNA was not isolated before running the nCounter® panel

