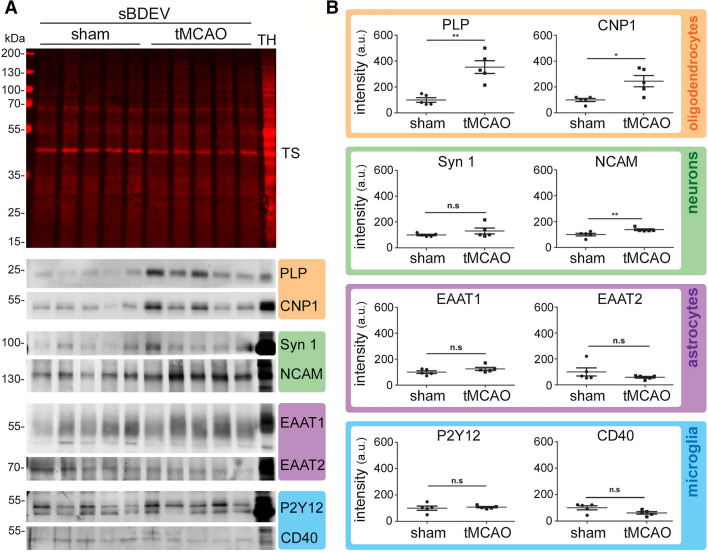
Fig. 4.
The contribution of oligodendrocytes to the BDEVs pool is significantly upregulated at 72 h after tMCAO. A Western blots of sBDEVs samples from tMCAO and shams (n = 5 per group) blotted for cell-type-specific markers: PLP and CNP1 are used as protein markers for oligodendrocytes (orange frame); synapsin 1 (Syn1) and NCAM as markers for neurons (green); EAAT1 and EAAT2 as protein markers for astrocytes (pink) and P2Y12 and CD40 as markers for microglia/macrophages (blue). TH is a total mouse brain homogenate loaded in parallel for comparison purposes. TS is a representative total protein staining of the nitrocellulose membranes (TSs of all blots used for these analyses are provided in Suppl. Fig. 5). B Dot plots showing the quantifications of the western blot intensities. For the quantification, each band intensity was first referred to the corresponding lanes of the total protein staining. Both markers for oligodendrocytes were found significantly increased upon stroke. Regarding neuronal markers, NCAM was significantly increased while Syn1 only showed a tendency to be elevated. Exact p-values are given in the main text

