Figure 6 –

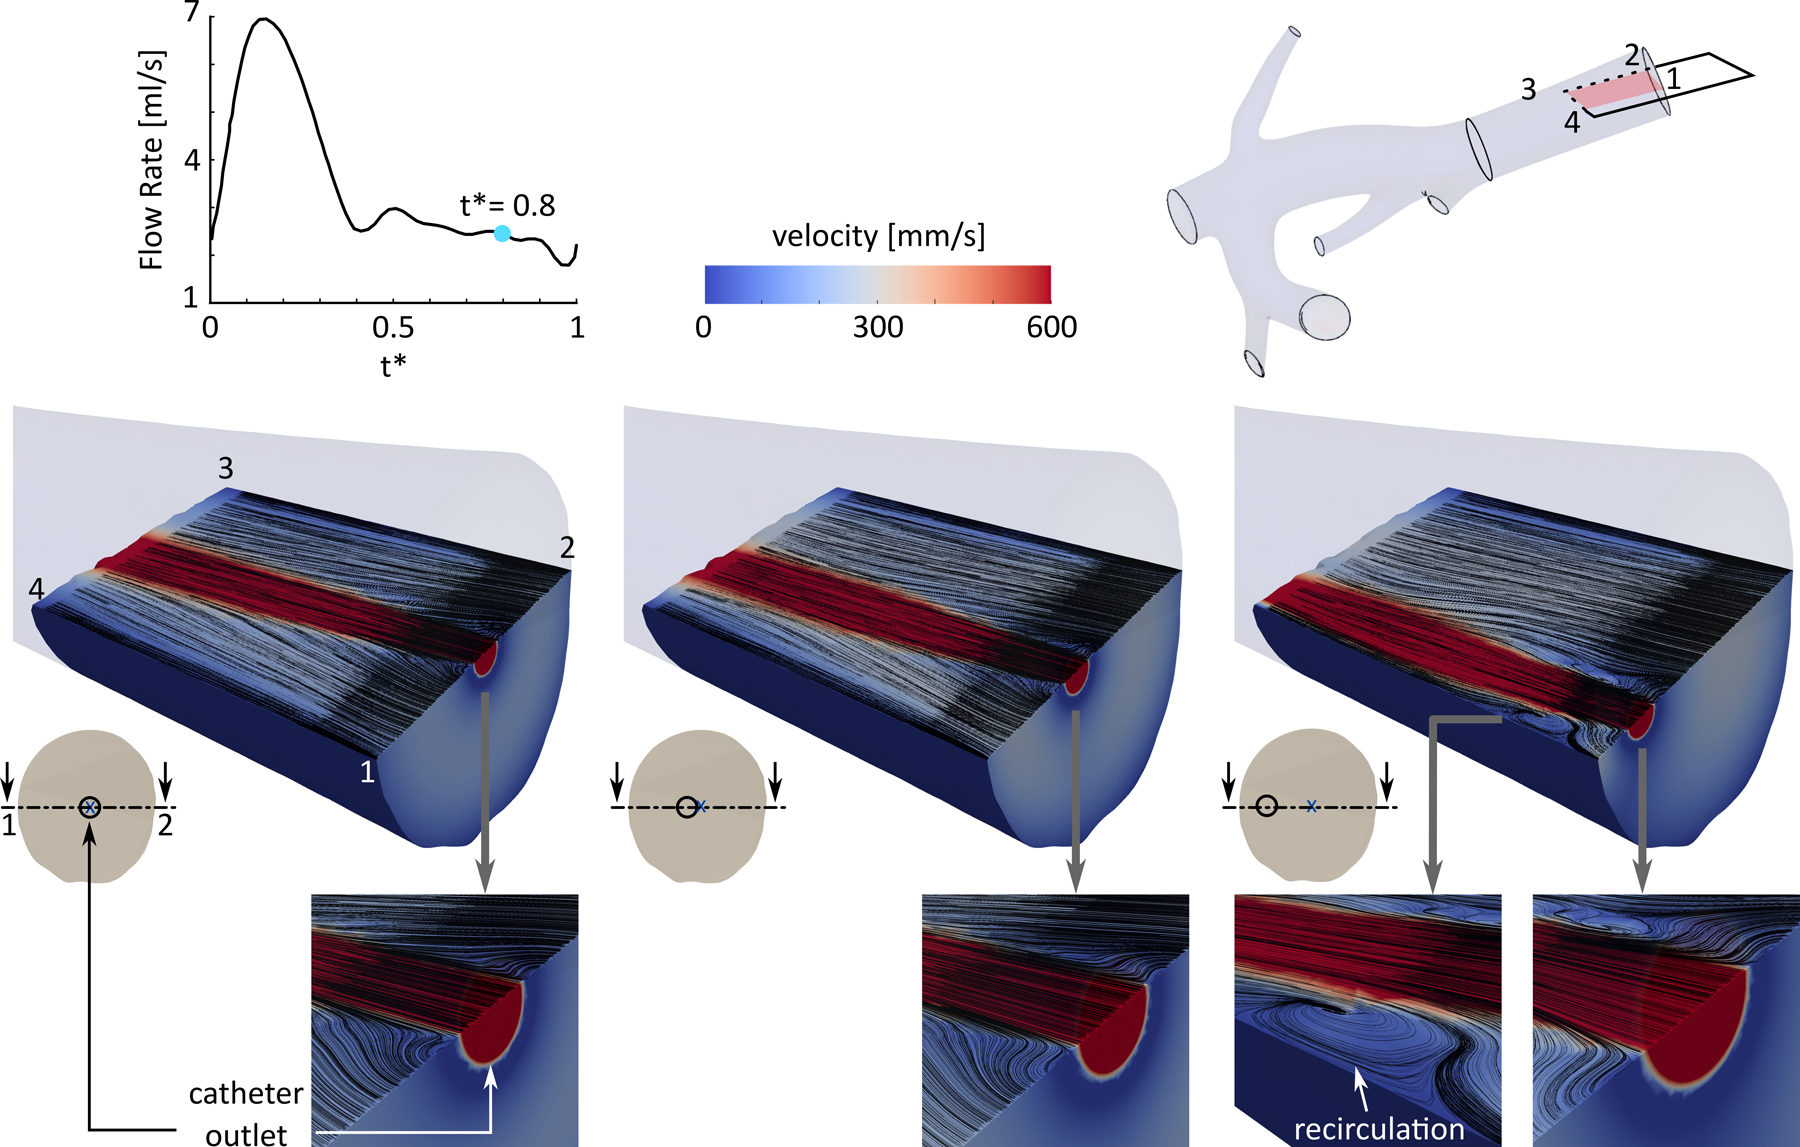
Local flow field downstream of the injection plane for three catheter locations in plane A at t* = 0.8, shown in arterial cross-sections. The black lines show the catheter and blood flow streamlines.

Local flow field downstream of the injection plane for three catheter locations in plane A at t* = 0.8, shown in arterial cross-sections. The black lines show the catheter and blood flow streamlines.