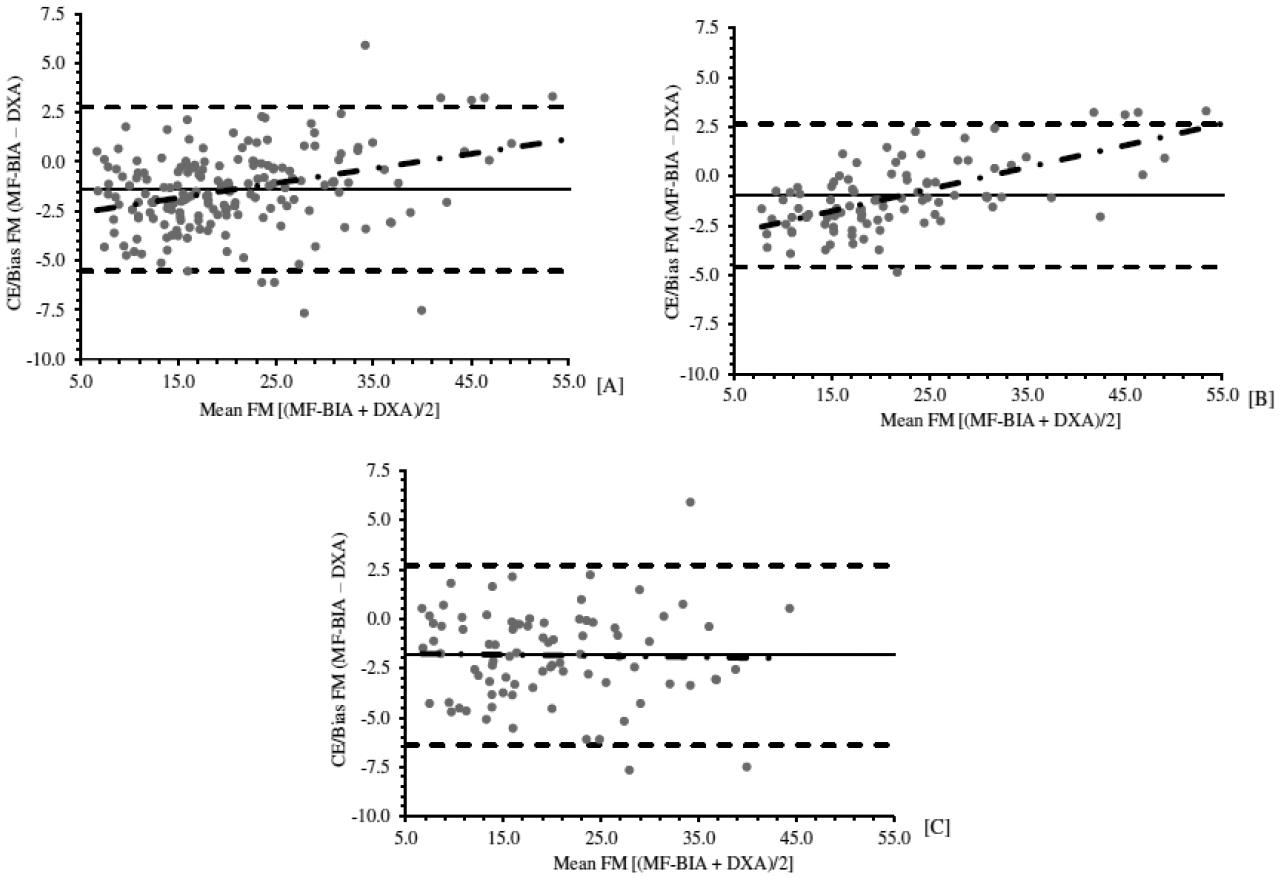
Figure 2.

Bland and Altman plots comparing fat mass (kg) between multi-frequency bioelectrical impedance analysis (MF-BIA) and dual energy x-ray absorptiometry (DXA) in Hispanic adults. [A] Entire group (n=181); [B] Females (n=97); and [C] Males (n=84). The middle solid lines indicate the constant error. The dashed lines represent the upper and lower limits of agreement (± 1.96 SD). The dashed-dotted regression lines represent the proportional bias.
