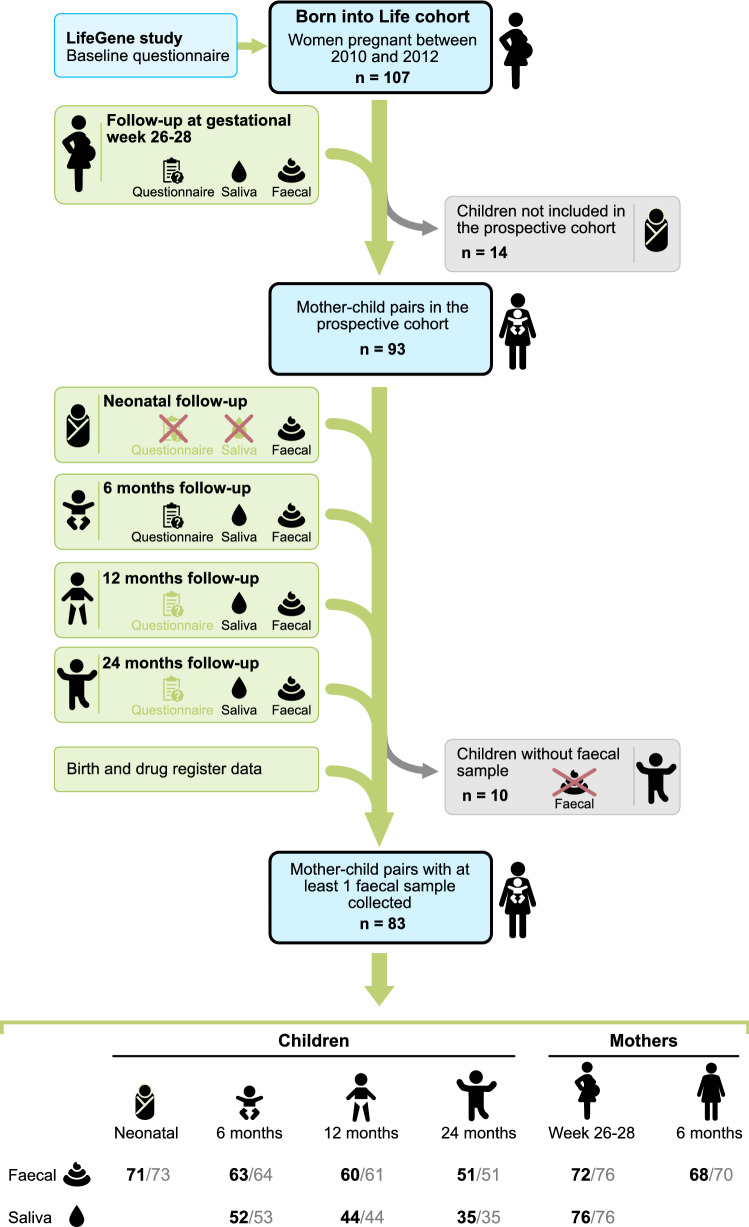
Figure 1.
Flow chart of the study population. The cohort consists of pregnant women who lived in Stockholm, Sweden enrolled in the LifeGene study. After obtaining parental consent, the children were included in the prospective cohort (n = 93). A red cross indicates that questionnaires or saliva samples were not administrated. Light green questionnaire symbol indicates that the answers were not used in the current study. Number of samples with at least 12,588 reads reported in black font. Number of samples sequenced are reported in grey font. The figure is made by Andreas Dahlin at Visualize your Science.

